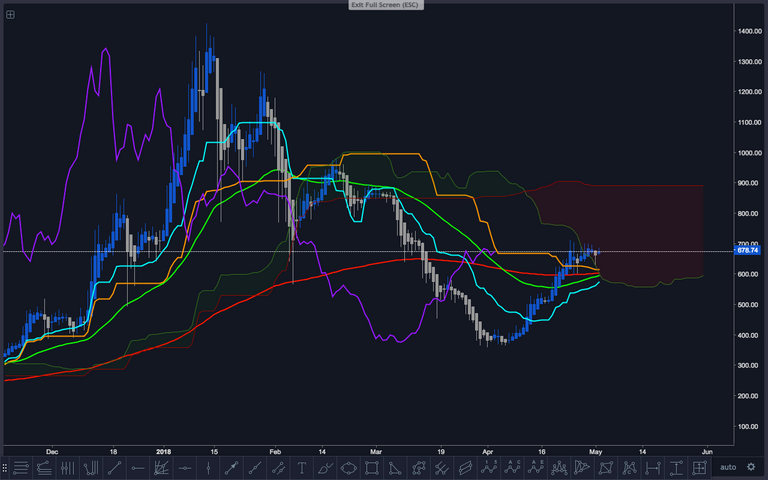
This my first post on Steemit since I opened my account...and it's about a crypto-token I fell in love with over a year go - Ether.
To analyse ETH/USD on the Bitfinex exchange daily chart I used the following indicators on the charting website TradingView:
Heikin Ashi candles
Ichimoku (20/60/120/30) - Tenkan-Sen (aqua), Kijun-Sen (orange), Chikou Span (purple)
50 EMA (green)
200 EMA (red)
200 MA (dark ochre line @ $642.80, used to determine if the market is on the "bullish side")
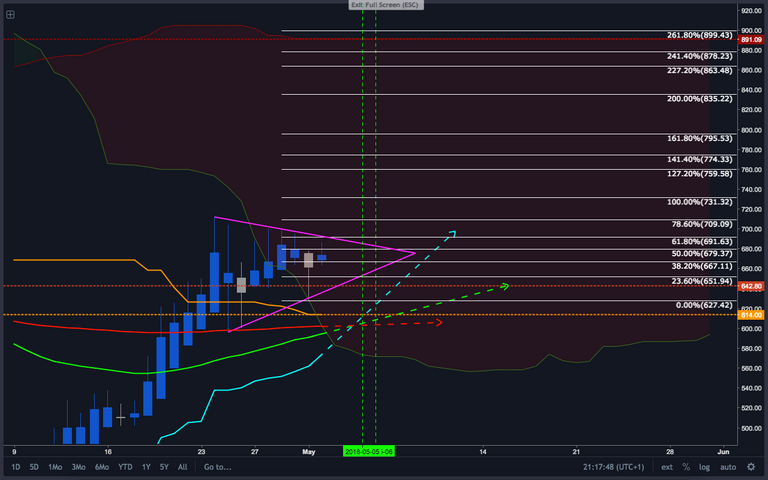
I then used Trend-Based Fibonacci Extensions to work out the potential targets.
I was glad to see that ETH managed to keep above the 200 MA. But the unique scenario I saw unfolding right before me was that of a bullish crossover between the Tenkan-Sen and the Kijun-Sen and a bullish crossover between the 50 and the 200 EMAs happening almost simultaneously in only a few days from now.
Furthermore, the price right now appears to be consolidating within a bullish pattern (the fuchsia triangle). If this plays out the way the moving averages are suggesting it would, then we could see ETH reaching the mid-high 700s pretty soon.
Should the market become more decisively bullish in the near future (e.g. it is appropriately sustained by volume, etc.), ETH could even attempt a Kumo (current top @ $891.09) break-out!
I apologies for having posted simple screenshots instead of the proper TradingView "published charts" but I wanted to share my findings with you ASAP.

