Fibonacci harmonic patterns are commonly used by traders to identify buy and sell signals. They're statistical patterns with many variations that have been profitable in the long-run since the early 2000's.
Here's a quick overview of a Fibonacci Bat pattern:
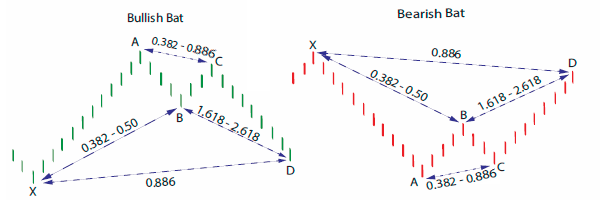
- D is the buying or selling price
- X is typically the stop loss price, but it should be slightly lower/higher
- B is typically the take profit price
Here's a market example of a Dash/USD trade using a 3 hour chart:
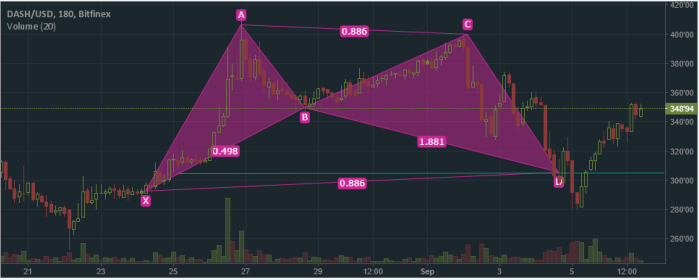
- Buy at $305
- Take profit at $345
- Stop Loss at $280
Risk/Reward Ratio
Risking: $305 - $280 = $25
Potential Profit: $350 - $305 = $45 or 14.75%
Risk/Reward Ratio: $45/$25 = 1.8
To stay profitable in the long-run, make sure that you're risking at least as much as your potential return, which means maintaining a risk/reward ratio of at least 1.
Happy trading!
Sir i want to ask u, the most important fibonacci lavel in 0.886 at XD ?