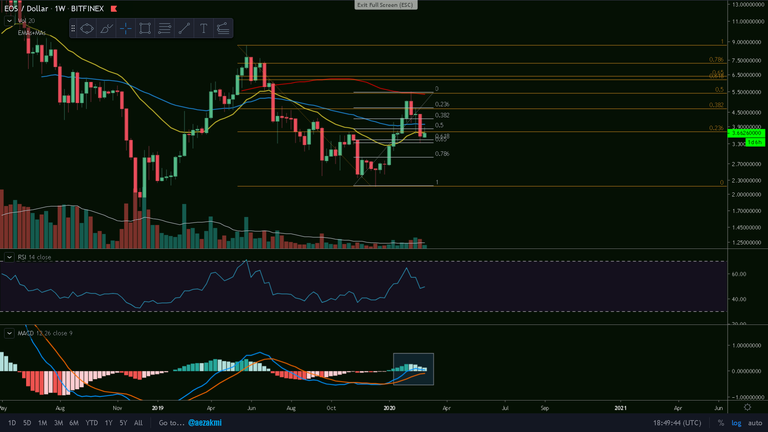
EOS/USD Weekly Chart
After the bounce in the Fibonacci golden pocket area (0.65-0.618) of the small Fib., EOS is now finding resistance at the 0.236 retracement of the big Fib., which aligns with the 21 weekly EMA (yellow). We have a descending MACD - Histogram and if Bitcoin continues to retrace these days, we'll get a bearish cross and I can see EOS revisiting the golden pocket area - around 3.40 & 3.33 region. The bullish scenario however, is for us to bounce at the 0.618 and also get a MACD bounce.
Ctrl + Click here to enlarge the image in a new tab (steemitimages)

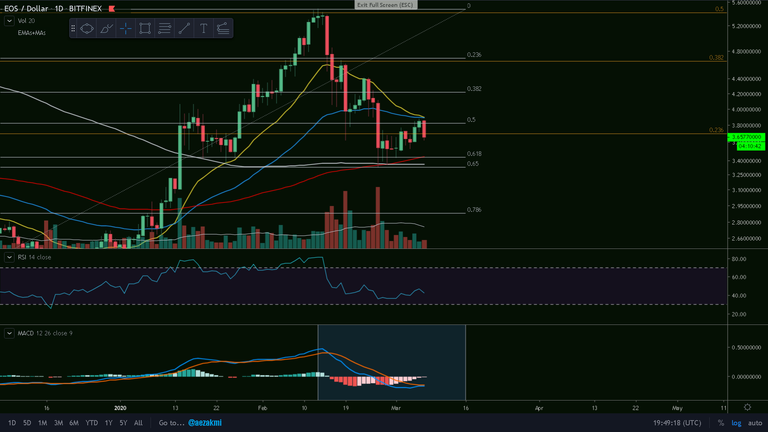
EOS/USD Daily Chart
Upon a closer look, we have the price getting rejected at the 21 & 55 EMA's and have the 200 MA (grey) exactly in the golden pocket area, as a potential target. Furthermore, there are some bearish signs: the increasing MACD - Histogram has flatten out and a MACD rejection seems probable. Besides this, we have the 21 crossing below the 55 and when this happens, usually the bears take over. The last (meaningful) 21 below 55 cross was in July 2019 and EOS had a +60% drop in price. However, maybe will get just fake cross, as it happened in November 2019 and continue our bullish movement.
Ctrl + Click here to enlarge the image in a new tab (steemitimages)


Thanks for reading and safe trading!✌
If you find this post useful, please:

Post Update:
Forgot to point out a very important aspect: the almost-2-year triangle pattern. If this continues, we could have EOS around 2.5$
Ctrl + Click here to enlarge the image in a new tab (steemitimages)
Update
Broke out of the ascending channel to the downside, looks kinda bad. The 0.618 (3.43$) seems like a potential target.
Ctrl + Click here to enlarge the image in a new tab (steemitimages)