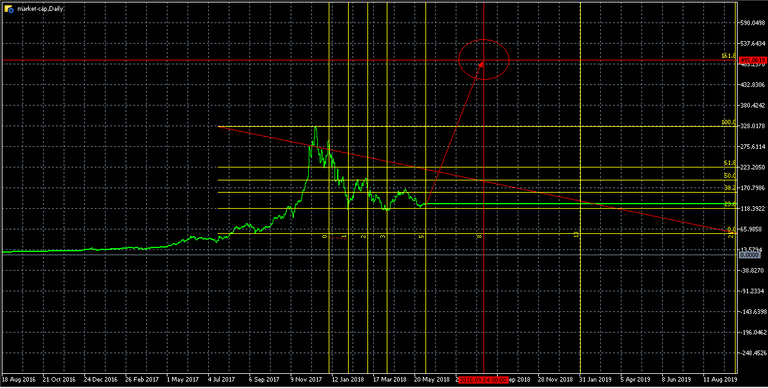
After importing crypto market cap data into metatrader, I used fibonacci retracement and time zone to create the golden ratio for my prediction. Below picture shows my analysis:

The time for high is between end of Aug and mid of Sep. It's pretty much the same as the up and down cycle of last year. To enforce my predicted number, I used the spiral golden ratio in the area to check. The result is that the focal point is nearly in the same place where I drew.
So, what does it mean for crypto future? It's still very potential, and for those missed the bull train in 2017, this is the right time to ride another one.
Note: This is only my personal view for entertainment and discussion. Take your own risk.

After rechecking, this data is from blockchain site. It's for btc market cap only. My mistake.
After rechecking, this data is from blockchain site. It's for btc market cap only. My mistake.