Hello Lads and Ladies,
Today we will be taking a look at EOSBTC. A very highly traded and divergently discussed coin.
I like trading EOSBTC because it respects its support and resistance lines pretty well and similarities, as well as patterns are very well recognisable.
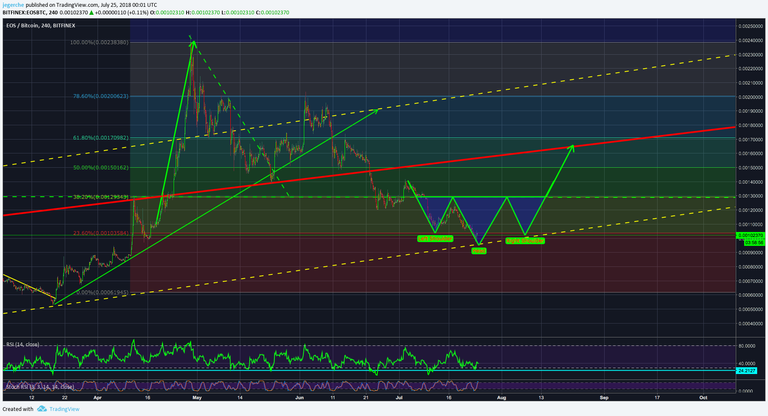
Looking at EOSBTC right now, we can identify very easily an ascending channel, which has been formed since the beginning and respected very well. We can see EOSBTC at the very bottom of this channel and even saw it touch the channels support and directly bounce up from there. This gives us already a brief confirmation of this trend line, yet we can expect it to be hit in the next few days once again. This hit would bring down the short-term average and actually lave and make some space for it to bounce and go up.
There are multiple reasons for it to bounce and go up. This situation that EOSBTC is in right now, reminds me strongly of the situation we saw bitcoin almost a month ago. If this plays out, this correlation might be very useful for the next few months.
So, the Bitcoin situation a month ago was an inverted head and shoulders formation with a double bottom at its "head". As we see it right now with EOSBTC, we just touched a very significant line of support, we are very likely to retest it very soon and with it form a double bottom. Here comes the tricky part, this double bottom has to hold and to actually bounce in a bigger manor. If the significant uptrend support does not hold and breaks, we will see EOSBTC getting REKT.

Nevertheless, the negative correlation between bitcoin and alts (BTC up, Alts down) and bitcoin being heavily overbought right now, we might actually see a short sign of life from the alts, including EOSBTC. This downtrend from the very top of the channel to the very bottom has been mesmerising and a form of bounce, as well as a retracement of this downtrend is very much needed - actually very soon, otherwise it really does not look good for EOSBTC.
Looking at the 4h RSi, we are in low regions, yet just had a small bounce. This expected retracement would bring the RSI down to approx. 24 points or even below, which is a strong historical indicator for a bounce (on 4h and daily). This would also form a double bottom on the RSI level, again indicating a higher chance of a bounce and increase.
This would be a string similarity to the situation of BTCUSD that we saw a month ago. So, with neckline being located just technically speaking at 124k, yet having a strong resistance at 130k we will see some significant price action there. For first, this strong resistance of 130k seems not to be crossed and most likely the rejection will lead the price to 105k to complete the "right shoulder".
IN NUMBERS -
- BUY @ 103k - 95k
- SELL @ 124k - 130k
- SL @ 90k
Make sure to check it out on Tradingview - https://www.tradingview.com/u/jegerche/
Instagram - https://www.instagram.com/bitcoin25.de/
Twitter - https://twitter.com/mreucho/
 me and you will find this page interesting because I am a TA expert and day trader that does daily updates and new posts about the hottest and most discussed coins.
Cheers, Tomas