The trend
The trend is the single most significant technical analysis trading tool and charting pattern. The trend is the general direction in which the market is moving. In some cases the trend is extremely easy to identify in other cases there are no clear trends
Markets do not move in straight lines, there is a constant pullback and forward push movement in the direction of the trend.
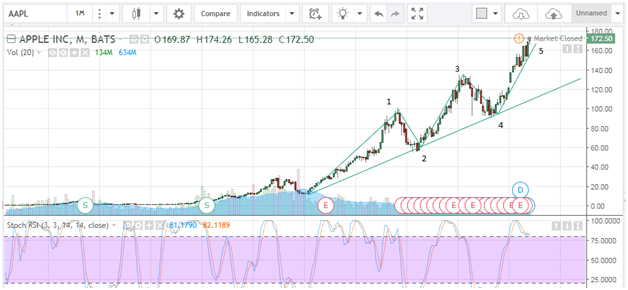
I have taken Apple Inc. share price movements as an example. On the figure a long term upwards trend can be identified. On the same graph I have drawn the forward and pullback movements on this trend.
An upward trend is considered a trend when the next high is higher than the previous one. In the graph, 3 needs to be higher than 1 and 5 higher than both 1 and 3. The point 4 needs to be higher than 2, but still lower than 3.
Types of trends and their length
There are 3 types of trends,
- Uptrend
- Downtrend
- Sideways
The sideways trend is an absence of a trend. Trends are identified by the direction and length. The supporting trendline connecting 2 to 4 is the long-term uptrend. The trends 2 to 3 and 4 to 5 is an example of a medium term uptrend. The trend movement from 1 to 2 end 3 to 4 are examples of medium term downtrends.
In each of the medium term trends shorter term trends will also be identifiable.
Sideways trend / channel
There are cases where the price trades between two distinct support and resistance lines as given,
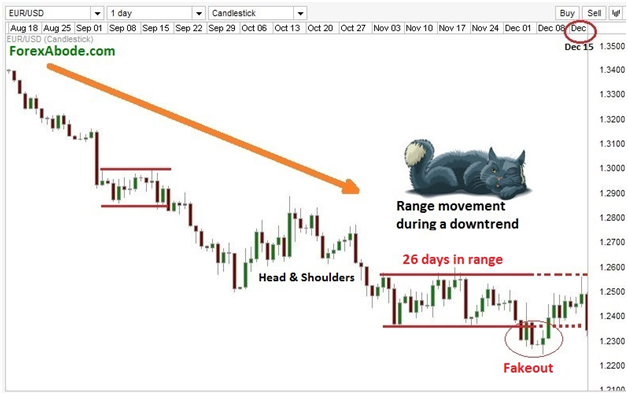
In this case there is not trend until the price either breaks convincingly above or below these ranges. It is known as a ‘fakeout’ in the case where the price breaks above or below these price lines, but bounces back between them.
Drawing proper trendlines
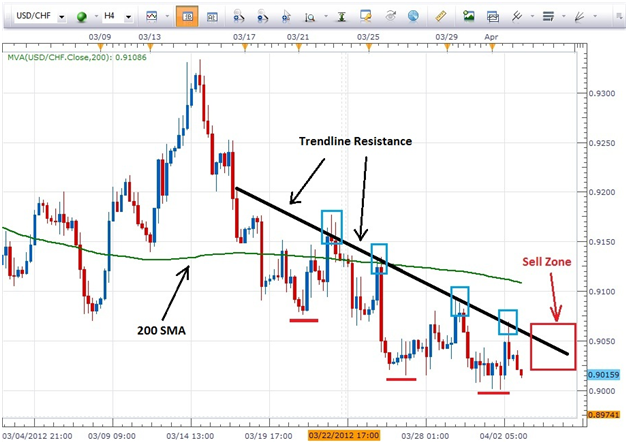
There are both resistance and support trendlines. Resistance trendlines are the downward sloping trendlines that connect lower lows as given in the figure below,
The trendline in the Apple stock chart is an example of a supportive trendline and connect higher highs. The more rebounds from a trendline the stronger it is.
Remember the ‘trend is your friend’. In technical analysis never trade against the trend.
We take a look at some of the more well known charting patterns with examples in the next posts, with some introductions to Dow Theory.
Till next time,
Tinus
** Images courtesy of tradingview.com, fxdaily.com and forexabode.com
img credz: pixabay.com
Nice, you got a 8.0% @minnowbooster upgoat, thanks to @boontjie
Want a boost? Minnowbooster's got your back!
To call @OriginalWorks, simply reply to any post with @originalworks or !originalworks in your message!
Good post