Thanks for the feedback! Appreciate it! @herbnspice
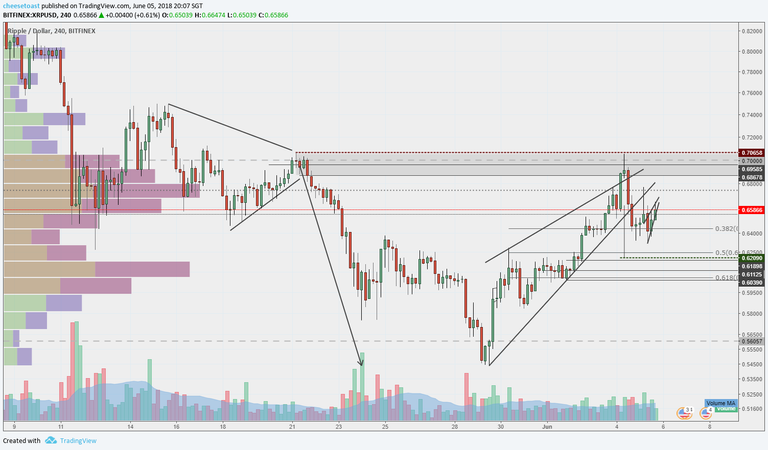
Have a look at the 4hr chart below and look to the left. You can see a previous breakout pattern with a tight squeeze ("consolidation zone") between 0.68 and 0.70 (grey area).
The strength of move/breakout to the downside was very strong. Roughly 6 times the range of the consolidation zone with no retracement!!! This tells us there was a significant imbalance between buyers and sellers. That is, there was more sell orders filled and few unfilled buy orders.
Given the speed and strength of the move, it is likely not all sellers orders would have been filled at this value area and would have missed the boat (I think its safe to assume whales do not market buy/sell into a position).
As price gradually returns to the consolidation zone, the number of unfilled buy orders will start to decrease as we know already know there was an imbalance in this value area. Therefore, we can assume it is a higher probability trade to sell into this area.
Hope that helps. I'm more of a breakout/pattern trader but aware of the general concept. Check out @rollandthomas. He specifically trades supply and demand zones and can probably explain better than me.

Thanks for the detailed response mate, much appreciated - i see what you mean.
It's worth noting also the speed and strength of the move was highly attributed predominantly due to btc's dominance and effect on the overall crypto market, where charts across all/most alts seems to be a blueprint over this specific period.
I'll check out rollandthomas, thanks for the link/tip.
cheers