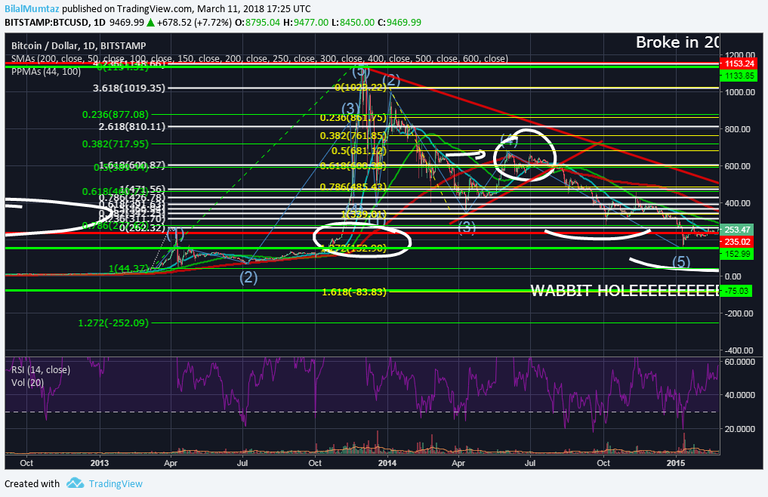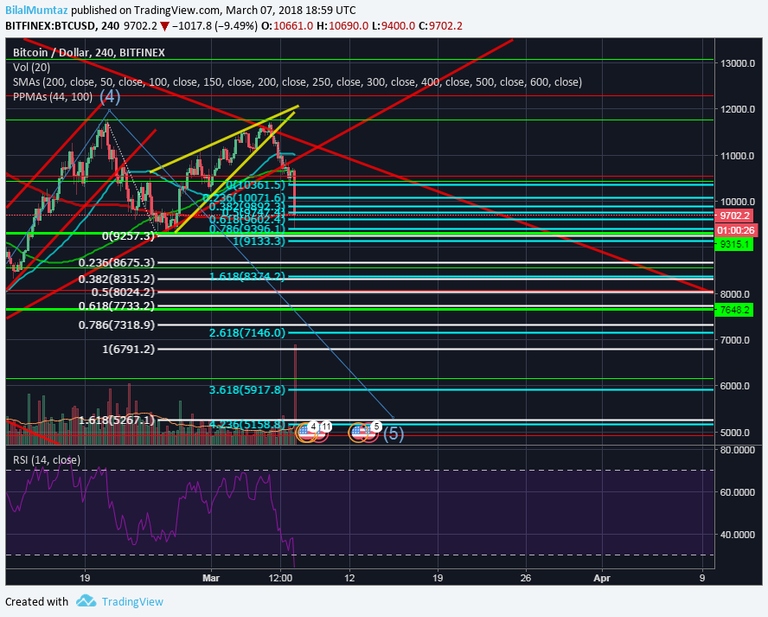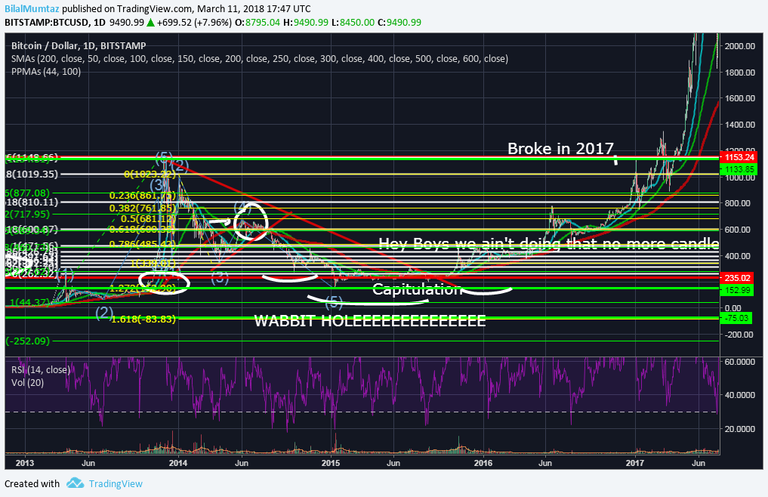
Above is the bitcoin 2013 chart Now let's see how perfectly they are crafting the 2013 chart all over again, It's beautiful in a way that human behavior and psychology can be ready by charts that is why the charts are spouse to any trader as they spend most of their time with them.
As you can see in 2013 the bottom of the 3rd wave ended on right around the 786 fib retracement and 0.236 extension. from there it made a fourth wave but struggled to break the 50% retracement fib which was pull from the top of the 3rd wave to the bottom of the 3rd wave. now look what happened in 2018

Damn perfect kiss to the .50 fib
.png)
this above picture was for some fun was just trying to copy my inspiration.

Anyways if the history repeats it self we might see $5000 and $3200 btc with high statistical probability
But what comes after next when they capitulate and accumulate ?

In the End i would like to thanks my mentor for teaching me the art my savior my messiah
Cool Post. Since you got the bitcoin tag do you have a prediction for Bitcoin over the next few days? Also followed you for future posts :)
we can go down to as low as $5k to $3.5k
hahaha its gonna happen
Congratulations @cryptopakistan! You received a personal award!
Click here to view your Board of Honor
Do not miss the last post from @steemitboard:
Congratulations @cryptopakistan! You received a personal award!
You can view your badges on your Steem Board and compare to others on the Steem Ranking
Vote for @Steemitboard as a witness to get one more award and increased upvotes!
thanks for clearing it man just wanted to help those who are scared