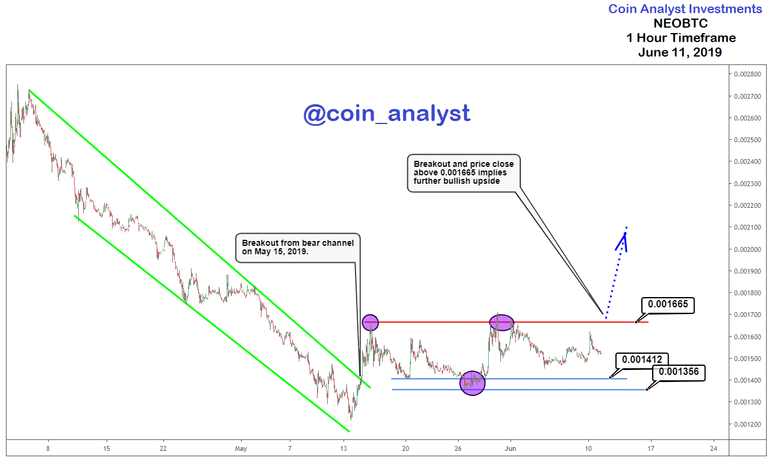
Conclusion for today’s NEOBTC analysis: Price closing above ~0.001665 implies more bullish upside for NEOBTC.
Intraday timeframe analysis of NEOBTC is presented using a candlestick chart. April 05, 2019 to May 14, 2019 saw NEOBTC remain inside of a bearish channel that is shown on the chart with a breakout following a day after.
Follow us on Social Media!
Instagram: https://www.instagram.com/coin_analyst/
Twitter: https://twitter.com/Cryptotrader029

The bullish implication of the breakout is currently still active even though a sideways movement has resulted. The upper and lower boundary of the ranging environment for price that has lasted over 3 weeks is also drawn with NEOBTC currently trading in the middle of the range.
The best course of action is therefore to wait for further price development to ensure the continuation of the May 15, 2019 bullish breakout.Buying above the upper boundary of the range i.e. 0.001665 can be considered as part of a conservative strategy or even buying above the May 30, 2019 price high of 0.001713.
Initiation of long (buy) orders prior to breakout is hence considered less conservative. This is due to the fact that it is not yet certain that the ranging movement is complete and prices having a chance to even head lower to test support between 0.001412 and 0.001356.
Our previous Bitcoin analysis (BTCUSD) before the current price rally was also posted for FREE and can be found below.
https://coinanalyst.investments/2019/04/26/btc-analysis