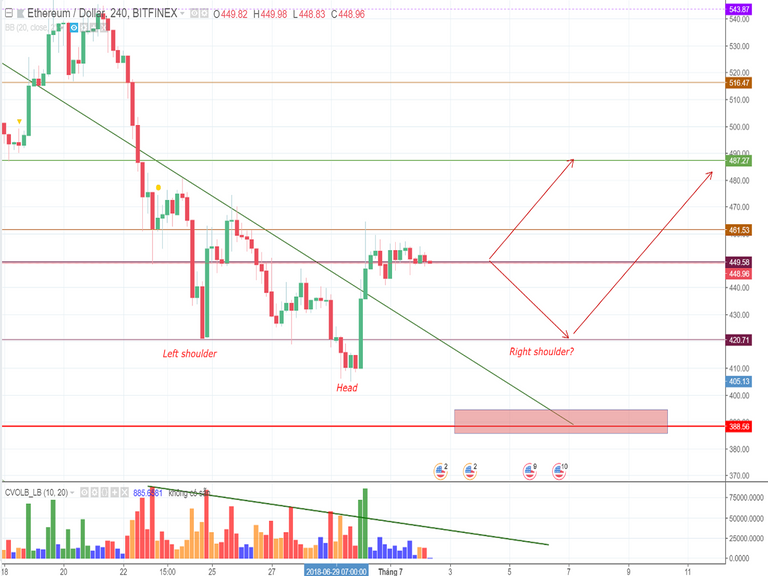
Last weekend, the Ethereum price experienced a significant correction before a narrow-range fluctuation. This is due to the fact that the traders do not know whether the price will continue the rally or reverse the trend. In chart H4, there is a probability that the head and shoulder pattern will be formed within the Ethereum price chart with the receding trading volume within the pattern formation. If the pattern is established successfully, the Ethereum price is likely to retrace temporarily to the level of $420 in order to shape the left shoulder before a rocket occurs.
However, if the buyers can lift the price up from a current narrow-range movement, it is possible for there is a possibility of the establishment of Adam & Eve Double Bottom pattern as well as of the surge of the cryptocurrency to the key level of $487.
Nevertheless, the strong support level of $388 is still waiting ahead. If the ETH price falls below the level of $420, there is a risk that opportunities the Ethereum price can be dragged down further to the hard support line.

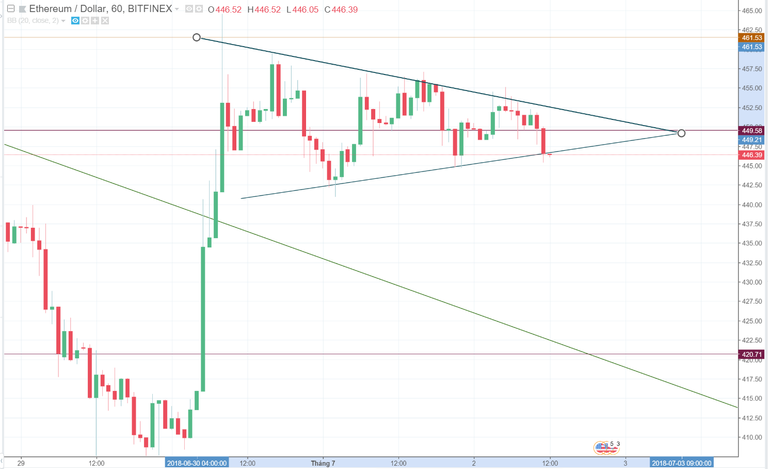
A symmetrical triangle pattern has been constructed right after a steep and sharp bullish trend. Besides, the Ethereum price has touched each sides of the pattern twice, indicating the possibility of the pattern escape. More signal bars are needed to know for sure about the breakout movement of the cryptocurrency price.
Written by @daigv from nami.today