Regular daily update on BTC ta analysts opinions.

Own comment:
- More or less things have slowed down and everybody is waiting either for the "final 5th wave" or for confirmations that the bottom is in already.
- Wave 4 seems to be completed or will be shortly we will see if we go down for the "missing 5th wave" towards the final bottom or if we go up and break through 9'400 / 10'000 and 10'700 which all would confirm the bottom and a new uptrend.
Analysts key statements:
- Tone: Weekly still looking good - he would like to see a close around the 9'000 so we have a clear hammer. He wants to see a 9 on the 4hourly over 9'400. 1hourly looks bullish too (7 hours ago).
- @haejin: He calls a decisive breakout out of the wedge. He sees price rise to 8'856 (my comment: which it did already. So good call). Sees a hammer forming on the weekly. That supports bullish move. Sees upward pointing wedge on 60 min chart which makes a pullback likely. But he expects just a minor pull back.
- no update today
Stays in general with its count. Next target is BTC going up to 10'000. After that it is decided if we just correct to 9'000 or go for another low at 4'900.@ew-and-patterns: - @lordoftruth: Enforces his bullish view as we trade above 8'600 resistance. Expecting a swingy day trading between 7'900 and 9'200.
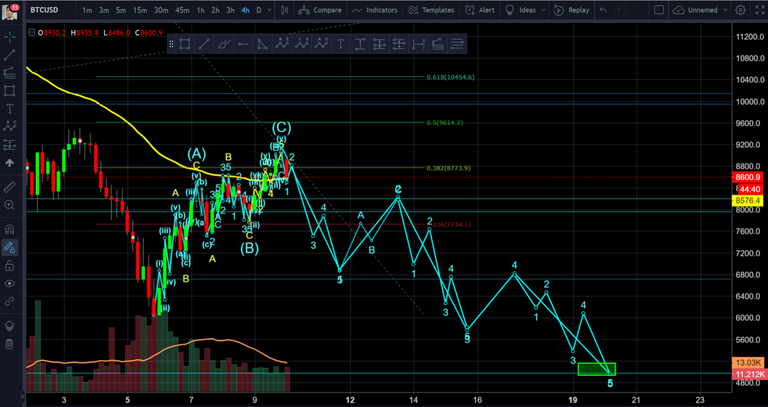
 @philakonecrypto: Bullseye - we went up to 9'080 today - his target was 9'050+. He considers correction wave 4 complete and now wave 5 is ongoing bringing us down to 4'800 - 5'200 in between Feb 18th and 24th. A possible way down there is shown here.
Overall sentiment: slightly bearish
(last: slightly bearish)


Reference table
| analyst | latest content date | link to content for details |
|---|---|---|
| Tone Vays | 10. Feb | here |
| @haejin | 10. Feb | here and here |
| @ew-and-patterns | 9. Feb | here |
| @lordoftruth | 10. Feb | here |
| @philakonecrypto | 10. Feb | here |
Definition
- light blue highlighted = all content that changed since last update.
- sentiment = how in general the analysts see the current situation (bearish = lower prices more likely / bullish = higher prices more likely)
- target 1 = the next price target an analysts mentions
- bottom = price target analyst mentions as bottom
Both target are probably short term (so next few days/weeks) - lower/upper barrier = Most significant barriers mentioned by the analysts. If those are breached a significant move to the upside or downside is expected. It does not mean necessary that the sentiment will change due to that (e.g. if upper resistance is breached it does not mean that we automatically turn bullish).
If you like me to add other analysts or add information please let me know in the comments.
good post @famunger
You are doing a great job, I love your work!
You want my donut, but it's mine !!! :-D
Mmmm donuts ;)
Nice post.good job.
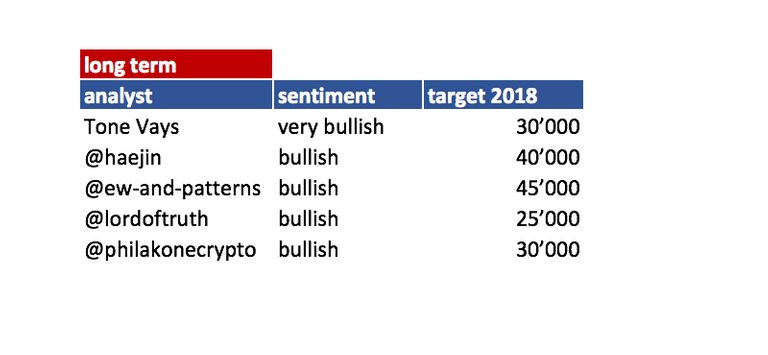
I like those long-term targets for 2018 ;-)
Interesting. Though, there are "rumors" that there will be an influx of investors due to the end of chinese new year, their analysis show that they really do not consider outside information aside from the chart patterns. I'm really confused now. One side of my brain says follow their analysis and sell, while the other says just hodl and the prices will rise after the 16th 😕
I see your confusion but it could all fall in line if the last low is coming soon. At that moment I won't sell anymore.
I actually think that the correction is over. The recovery will take longer than usual though. We might reach all time highs late summer this year.
hope you are right - that would be amazing
This is great, please keep doing this summary!
Good quality post very good information and excellent graphics thank you friend I invite you to support me on my blog I will be grateful greetings
Pacience, just pacience, in 6 months this crash is gonna be forgotten haha
This is what I really enjoy. I went back to the short term table from the 10th of February. In the past week bitcoin only went up. Only 1 analyst forecasted this. 80% was wrong. Thanks guys I could have earned huge, but I forgot to buy 😜