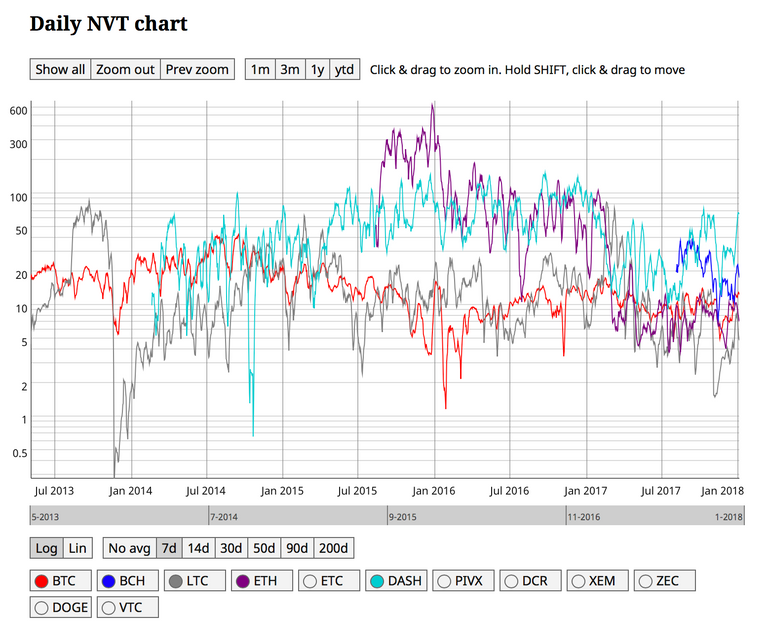
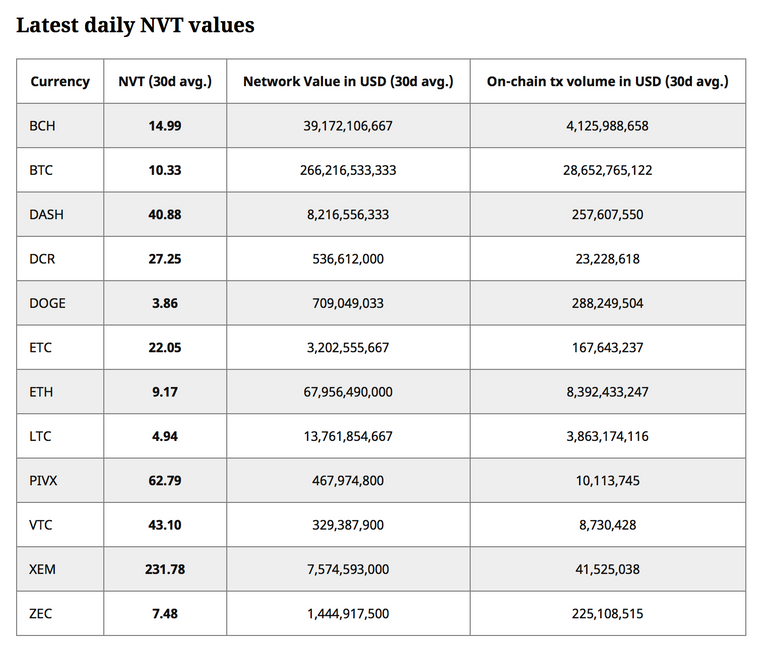
I have recently stumbled upon an interesting technical analysis tool, which measures the total market cap of a coin and compares it with the network total transaction value. It can give you a great insight how much a coin is over/underpriced.
The following chart shows BTC, BCH, LTC, ETH, DASH in log scale. The lower NVT value the more underpriced a currency. Rule of thumb shows that around 5-10 is a healthy ratio as it means the total market cap turns around in 5-10 days.


Here you can visit their website, really cool information for understanding underlying economics and also crypto trading. If you take a look at some coins, you can clearly see that there is no real volume behind them and therefore it does not worth investing in them.
https://coinmetrics.io/nvt/#assets=btc,bch,eth,ltc_roll=7_zoom=1478076767832.2583,1515110400000
If you like please donate ETH: 0xa4668067604aC04C2798d89A4ff8219690FB7C46
Congratulations @horike! You have received a personal award!
Click on the badge to view your Board of Honor.
Do not miss the last post from @steemitboard:
SteemitBoard World Cup Contest - Semi Finals - Day 1
Participate in the SteemitBoard World Cup Contest!
Collect World Cup badges and win free SBD
Support the Gold Sponsors of the contest: @good-karma and @lukestokes
Congratulations @horike! You received a personal award!
You can view your badges on your Steem Board and compare to others on the Steem Ranking
Vote for @Steemitboard as a witness to get one more award and increased upvotes!