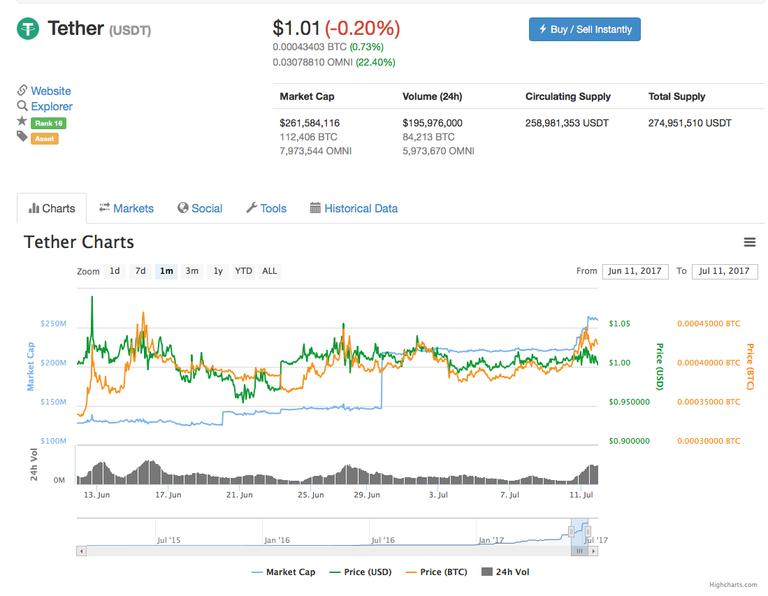
The Tether chart is USDT, it is used by Bittrex, Kraken, Poloniex and many more exchanges. It is supposed to be fully backed by real cash and is the financial backbone for most of the trading. This is how it looks like.

You can easily see what's going on on this chart. The volumes are exploding the past 24 hours. The market cap is going up, when you zoom in you see the btc price going down. Tether is being purchased. This chart shows the combined volume of all cryptos on every exchange that uses it. But we can easily look at what's really happening by pressing the markets tab.

Just remember, we want Tether to do as bad as possible. It is the anti-crypto. So keep an eye on this chart and if the direction doesn't change don't gamble on something magical because in the end it boils down to real money.
During these times, just stay away from the tokens if you don't know what you're doing. Tokens aren't linked to usd and crashes can amplify your losses. Your token losing value to bitcoin, and bitcoin losing value to usd.
More information: https://tether.to
The Tether chart: https://coinmarketcap.com/assets/tether/#charts
Bonus: https://steemit.com/cryptocurrencies/@icoprimers/to-long-token-holders
Cool news. Thanks.
Good report... BTW be careful here: https://steemit.com/cryptocurrency/@tarquinmaine/warning-coinbase-bitcoin-transfers-are-showing-delays-of-up-to-3-days
Hmm thought of buying this since its still very affordable.
I did not know that this even existed. Thanks...........