2019 will see the ICN token slowly die as it gets replaced by a security token. While ICN's days may be numbered, ICNHodler.com's certainly aren't and Q1 2019 saw us push ahead with more development...
Q1 2019 summary
After a disastrous Q4 2018 for the crypto market, things stabilised and picked up a bit in Q1 2019. It was never going to impact ICONOMI investors much given that they can't trade, but a continued decline in market value would obviously impact on book value and put greater pressure on cashflow for projects that ICONOMI are invested in and also ICONOMI themselves.
New features / site updates
In the Q4 2018 report, the targets were:
- Portfolio Profile Pages
- Portfolio Ranking System
- Measuring AUM to guesstimate deposits / withdrawals
2/3 are live in some form with the ranking system still in progress.
Portfolio Profile Pages
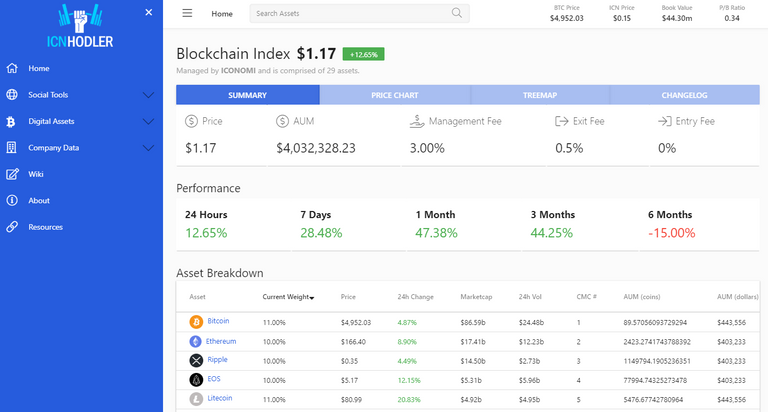
Up until this quarter, there was a lot of data on portfolios spread across separate pages. Price charts, AUM history, portfolio composition and activity all existed but didn't really link to each other and were difficult to navigate to. As of now, they're all visible from within a single portfolio page i.e. https://icnhodler.com/daas/BLX
Portfolio Ranking System
In progress. This will be a target for Q2 and is a bit more complex than I'd originally planned.
Measuring AUM to guesstimate deposits / withdrawals
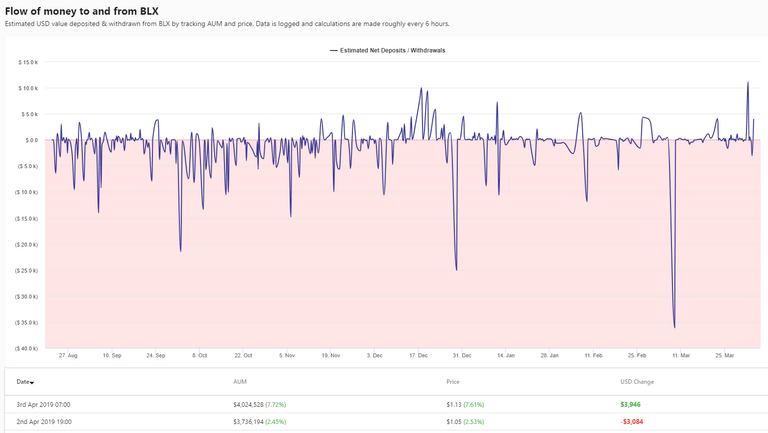
Estimated deposits / withdrawals based on AUM is now available in graph and table format for all public portfolios going back to August 2018. It could be found using the following url structure: https://icnhodler.com/moneyflow/BLX
This will replace the old blockchain-based system of recording BTC and ETH flowing in and out of known addresses as it's a more reliable and comprehensive way of measuring the flow of money in and out of ICONOMI. It's still not perfect and will never be accurate but it should be a pretty good estimate.
In Q2, I plan on extending this feature so that we can have a summary view of all public portfolios i.e. we can view total estimated deposits / withdrawals rather than just for a specific portfolio.
Q1 2019 Traffic
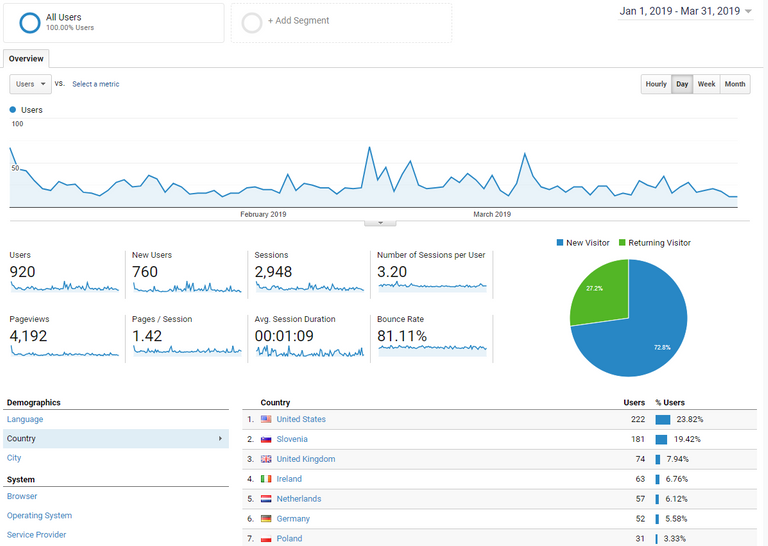
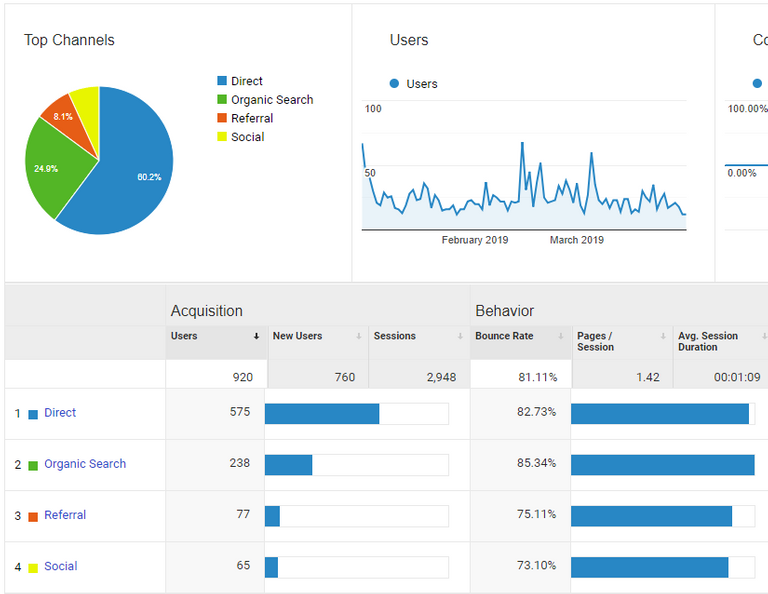
Traffic was down significantly in Q1 2019 compared to the previous quarter. Why? I'm guessing, but I'd say a combination of ICN becoming virtually untradeable / defunct and also a general decline in interest in crypto market if we take Google Trend data as a guide.
991 users (-40%)
2948 sessions (-49%)
27.20% returning visitors (+0.2%)
80.61% bounce rate (-0.62%)
As outlined in my last report, I'll be taking the site in a new direction so that it will become less ICONOMI-specific over time. This should mean more features and data that will be useful to a wider crypto audience.
Plans for Q2 2019
The remainder of 2019 will be a busy year for me personally. As a result, I don't want to overpromise and underdeliver on new features & development. Having said that, I'm a firm believer that if something is important to you, you will make time for it so I do intend to keep developing as much as possible. The results probably won't all be visible within Q2, but will lay important groundwork for later quarters.
Portfolio Ranking System
This was a goal for Q1 that will now become the main focus for Q2. It's quite a big task and important to get right. It must be able to scale and it must be able applicable to coins / tokens too.
Total AUM Estimates
Estimated deposits / withdrawals since August 2018 (calculated based on variations in AUM & portfolio prices) is now available for all portfolios (as mentioned earlier in the report). The next step is creating a summary view of total combined figures. Figures between two dates is also something I'll be introducing and this will most likely only take the form of monthly views initially.
Behind the Scenes Spring Clean
Most of the ICONOMI data being processed / collected now comes from the ICONOMI API. There's still some bits that don't and what I want to do is try to keep things as modular as possible along with introducing more logs and alerts for when things go wrong e.g. when API requests from certain services timeout or become inaccessible.
From and end user perspective, it's also important to know when the prices / data was last updated so that's something I'll also be trying to improve across all pages.
Congratulations @jesusthatsgreat! You have completed the following achievement on the Steem blockchain and have been rewarded with new badge(s) :
You can view your badges on your Steem Board and compare to others on the Steem Ranking
If you no longer want to receive notifications, reply to this comment with the word
STOPVote for @Steemitboard as a witness to get one more award and increased upvotes!