DASH is on the move again. As i think most all cryptos will begin to move also. Whats not certain is whether its the bottom of the holiday(in the US) selloff or if its only a pullback off the lows to then sell off again. Thus is the nature of the markets, not even the best traders know with certainty. One can only react accordingly to the markets movements.
[DAILY CHART]
The DAILY action shows DASH breaking out above previous major resistance. The candle that broke out closed very weak, and the candle didn't even close above resistance. Subsequent candles managed to close above only to selloff down to support area off the bottom of the bull channel. Buyers saw price cheap bought back into the markets, and once again its challengin that area of resistance. A level can only hold so long before its broken, in this case it looks like resistance will break down but we want to see strong bull candles close above on the DAILY chart.
[4HR CHART]
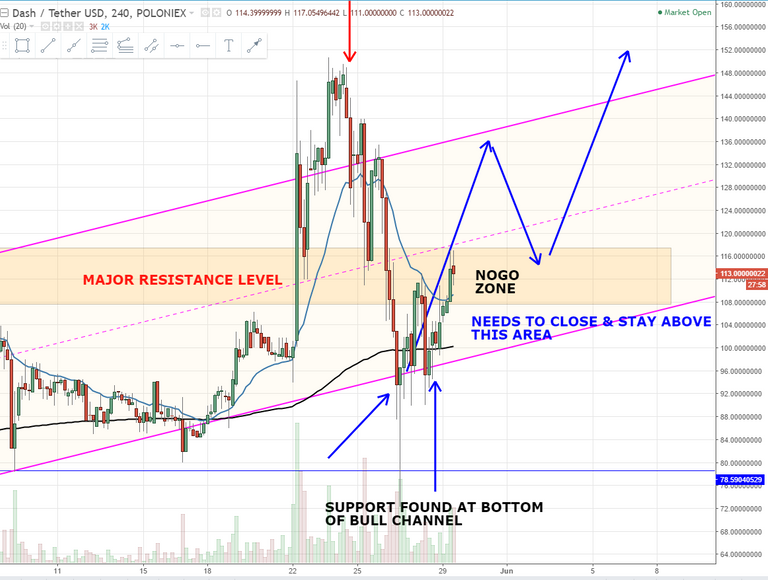
Looking closer on smaller time frame, we have the NOGO ZONE where we want no part in any action there. Best to stay out of markets until were clear from this area. We are seeing the 2nd bounce off the rising bull channel and so fart its challenging that NOGO ZONE. Currently there can be 2 scenarios played out:
- If price falls below this zone, we would look at the bottom of the rising level on the bull channel for support. If that fails then price will likely continue going lower.
- If price manages to stay above the NOGO ZONE, then we want to see confirmation on the DAILY chart of price closing above this area to continue back to retest of the highs.
Until then its best to sit on the sidelines and watch the action play.
This not a signal service, nor is it financial adivse. You buy and sell as you please.
Happy trading folks.


I have a similar analysis of Dash as well. I don't like to see price spend too much time at the bottom of channels since a breakdown is likely after buy orders dry up.
yep, ideally you'd like to see price bounce strong off that bottom of the bull channel. Price is caught in a wedge betweeen the the major horizontal resistance and the rising channel support. Well see how price plays out in this area