Here's a brief look into what I've noticed with Bitcoin over the past week or so. Before you read completely into this, however, you should be aware that I am by no means an expert, nor do I claim to be. Take this as you will, be it to praise or criticise. I'm always looking to improve my analcyst strategies and skills. I mean analysis. In any case, I'm just some bloke with a liking for this shit, so relax and take it all with a grain of salt, especially if you yourself don't actively try to analyze charts.
Some things to know -
LP: Lowest Point/Lowest Price
FPR: First Price Rise
FDAR: First price Drop After Rise
CS/RBFD: Current Support/ Resistance After First price Drop
PL/CR: Previous Lows/Current Resistance
TBM: True Breakout Marker
Right then! Jumping straight into it: 
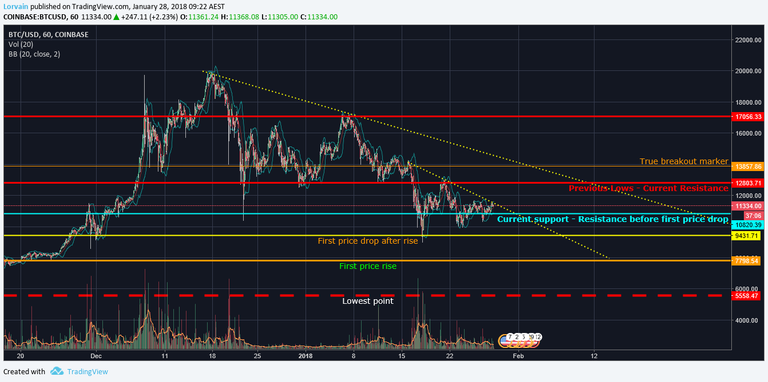
Starting from the bottom up. The red dash line indicates the rough price and location of an early low. This low was before the December price hike, so it's reasonable to presume it will the be lowest reasonable price/point. I reckon it's unlikely to hit this point any time in the near future, but it can happen. So be mindful when watching the carts!
Then we have the first price drop, or FPR, which seems like a reliable place to buy in because we can presume is won't drop lower. However, in saying that, watch that sort of shit carefully because it can drop lower and if it does then it isn't likely that we'll see a return to the lowest point, or LP.
The first drop after the rise, or FDAR, indicates that we will see a new true support line. This line indicates that we shouldn't see a drop lower because it has established a support before finding a new resistance. Again, take that as you will, the market is a volatile place and no one knows anything truly and absolute.
That'll bring us to my prediction, which is simply a predication and not a fact: 
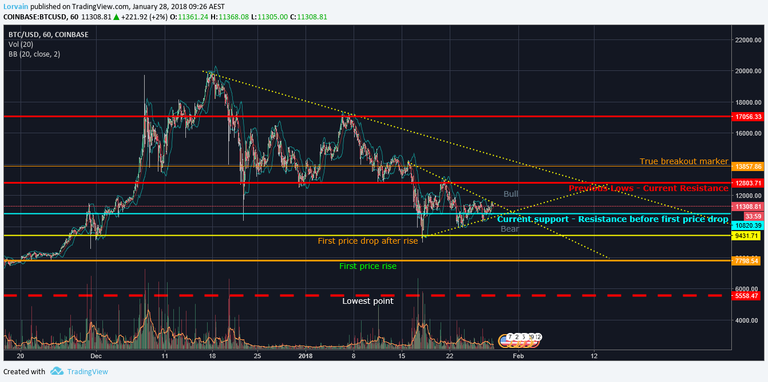
If the trend continues, which I doubt, into the triangle I've marked as 'Bull,' then I can see a Bullish happenstance. Bitcoin will rise a few hundred, nothing major, and Altcoins will froth. However, if Bitcoin follows the Bear marker, which I reckon it will, then we can expect some dropage in both Bitcoin(Obviously) and Altcoin prices.
In saying that, I have personal investment into Siacoin and Po.et, which I'll go into in another article at some point.
In any case! The point is: Watch these prices and watch the minute-15 minute charts. If you honestly want to invest and make a bit of cash, then research these projects and concepts. Don't take my word for it. I could be wrong as fuck. You have to conduct your own research and invest in a project your heart connects with. Trust yourself and know that there is no such thing as a bad investment, only bad advice.
The orange dotted lines that go diagonal, yeah, I reckon Bitcoin will stay within that limit until the end. How vague is that, ahaha. Point is, watch ALL of those lines especially those orange dotted lines. If it break one or the other, we'll see some true action. Until then I'd buy at the FDAR or DPR.
Again, I am not an expert, nor claim to be. This is not financial advice nor am I telling you to invest.