Hi my friends, here is Bitcoin chart.
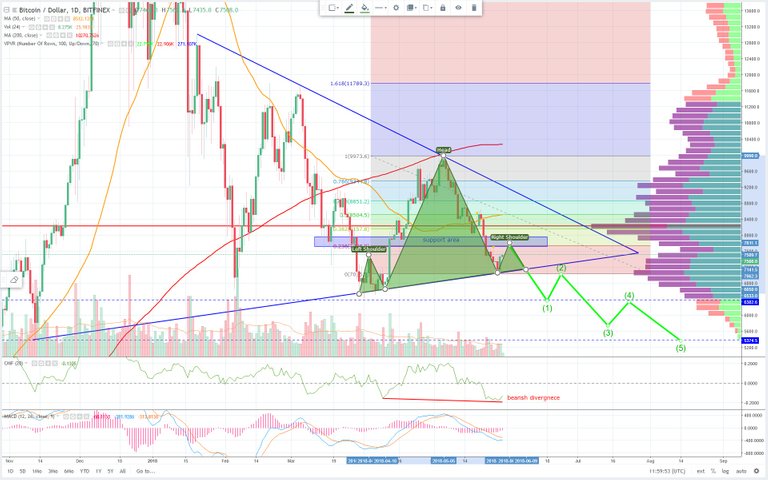
It looks like head and shoulder pattern. Currently expect price go up to blue support zone (7700-800USD) then the top of the right shoulder could be formed. If the lower triangle line will break, next support is 6400 USD.
CMF indicator show bearish divergence.

Majkee
( I am sorry for my English)
The inverse head and shoulders is much bigger than the one you have drawn for us. It is almost the whole triangle that is holding. Let me know if you see it :)
This is pattern? @kidmartin-95
I do not think the current market situation is show complete this pattern. Large volumes are missing, more money needs to be pumped into the market. But I hope you are right :)