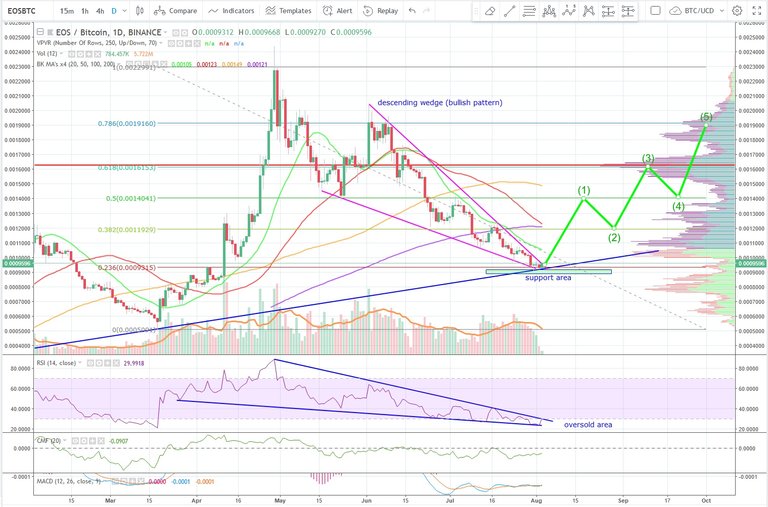
Hi my friends, here is daily EOS chart.
Currently, EOS looks very interesting. The price is at the bottom of the blue line and at the top of the descending wedge . RSI is in the oversold area.
If you want to update,please give me like, thank you.
Majkee
(I am sorry for my English)
