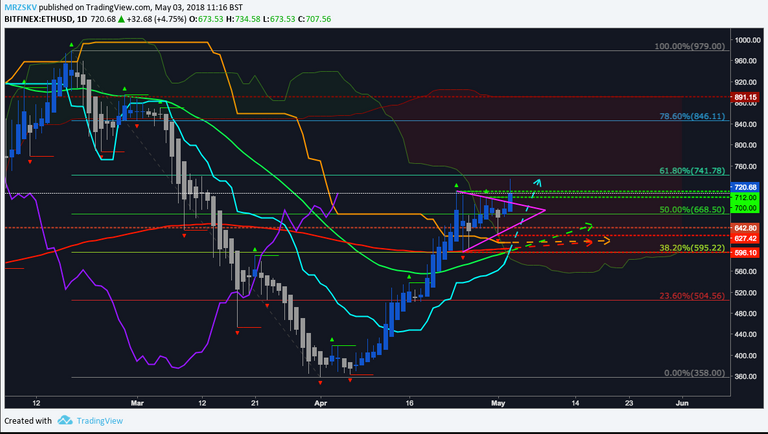
Hi, Steemit friends. Just a quick update on yesterday's post regarding ETH/USD (daily, Bitfinex).
The bullish triangle pattern worked in our favour and we're now getting closer to the moment of the multiple bullish crossovers - Tenkan-Sen (aqua) crossing Kijun-Sen (orange) from below and the 50 EMA (green) crossing the 200 EMA (red) from below .
ETH price kept above the 200 MA (dark ochre line @ $642.8) and is now inside the 61.8% Fibonacci area of the bearish structure which started on February 18th and this is a very positive sign. We need to wait and see how ETH bullS will behave from now on - will they let the price consolidate before a giving it a further push or will they keep on buying to have it moving straight into the 78.6% area? I'll be keeping an eye on a number of indicators, among which, the OBV (On Balance Volume) and the UO (Ultimate Oscillator). The latter is my favourite tool for spotting divergence and I find it way more reliable then, for example, the RSI for that as it works on multiple time-frames.
Lastly, I added to the chart a couple of fractal highs (dotted green lines @ $700 and $712) which form the current short-term resistance area and two fractal lows (dotted red lines @ $627.42 and $596.10) which form the current short-term support area. Also, the Fibonacci-based targets depicted in one of my previous charts are still valid.
Happy trading!
