Sell it it will down
Bitcoin cash price has likely completed a correction at $740 against the US Dollar, and BCH/USD is now positioning for more declines.
Bitcoin Cash Price Weekly Analysis BCH USD
SPONSORED ARTICLE: Tech Analysis articles are sponsored by SimpleFX - Simple as Never Before,
SimpleFX is a robust online trading provider, offering trading with Forex CFDs on Bitcoins, Litecoins, indices, precious metals and energy. Offers simple and transparent trading conditions.
Key Points
Bitcoin cash price after a sharp decline corrected higher towards $740 against the US Dollar.
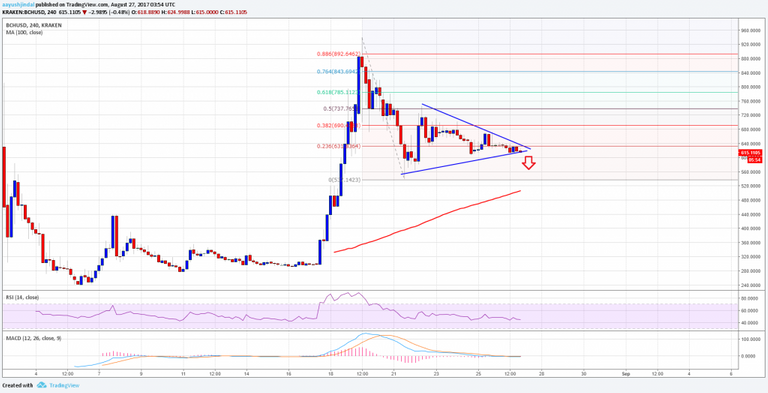
There is a contracting triangle pattern forming with support at $600 on the 4-hours chart of BCH/USD (data feed from Kraken).
A break and close below $600 could open the doors for more declines in the near term.
Bitcoin cash price has likely completed a correction at $740 against the US Dollar, and BCH/USD is now positioning for more declines.
Bitcoin Cash Price Support
There were choppy moves in BCH price this past week as it moved above the $700 level against the US Dollar. After a decline towards the $530 level, there was a correction initiated. The price moved above the 38.2% Fib retracement level of the last decline from the $640 high to $530 low. However, the upside move was limited by the $750 resistance zone.
The price failed near the 50% Fib retracement level of the last decline from the $640 high to $530 low. After the failure, the price started a declining path and currently trading below the $660 support area. There is a contracting triangle pattern forming with support at $600 on the 4-hours chart of BCH/USD. There are high chances that the pair would break the triangle support at $600 and move down. As long as the pair is below the triangle resistance at $650, it is at risk of a downside break.
Bitcoin Cash Price Weekly Analysis BCH USD
Once there is a break, the pair could trade towards the $530 low. Alternatively, if buyers come into the action and manages to take the price above $650, there can be a retest of $740. It all depends on the upcoming break either below $600 or above $650.
Looking at the technical indicators:
4-hours MACD – The MACD for BCH/USD is mostly flat and suggesting range trading.
4-hours RSI (Relative Strength Index) – The RSI for BTC/USD is currently below the 50 level, and pointing a bearish sign.
Major Support Level – $600
Major Resistance Level – $650
Hi! I am a robot. I just upvoted you! I found similar content that readers might be interested in:
https://thebitcoinnews.com/bitcoin-cash-price-weekly-analysis-bchusd-bearish-breakout/