Hello
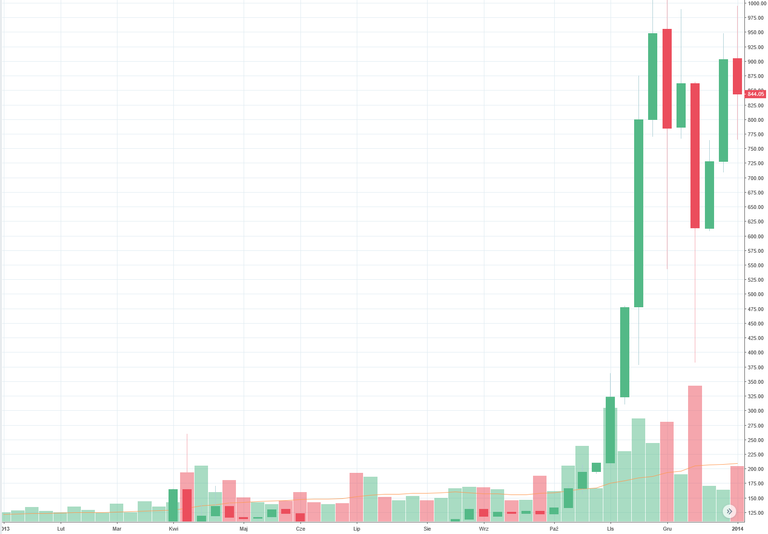
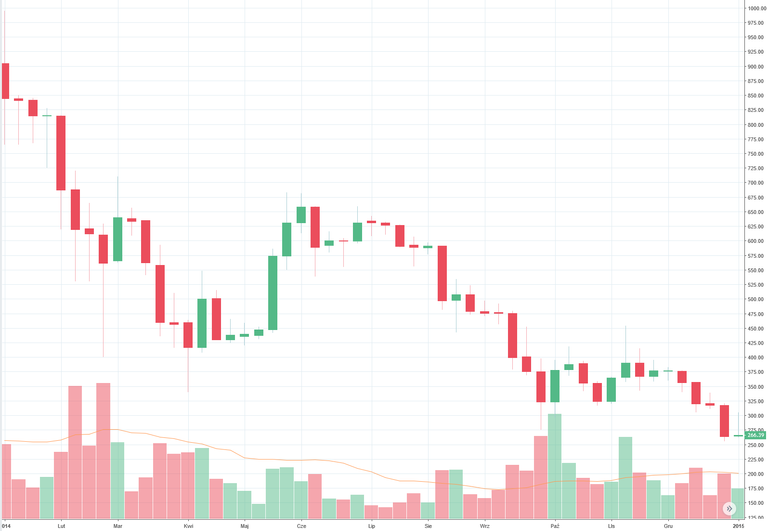
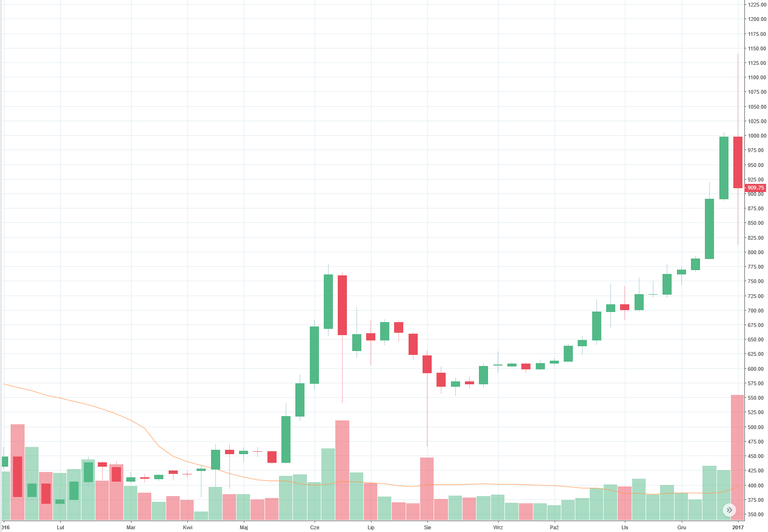
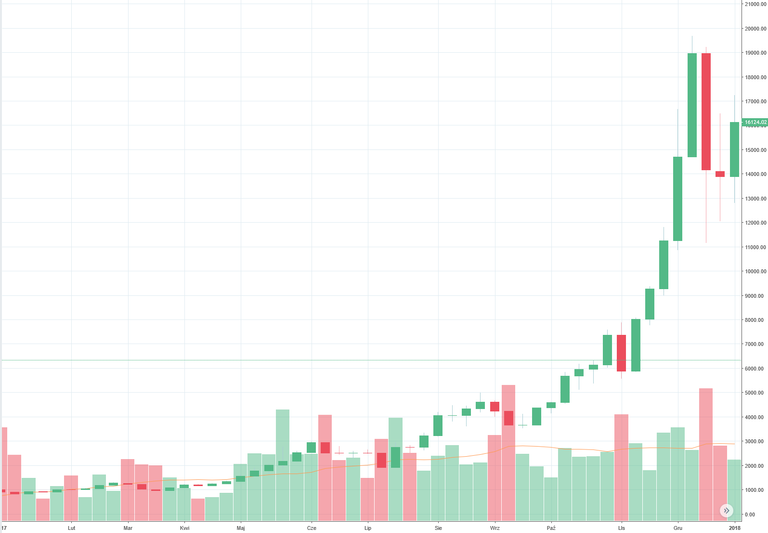
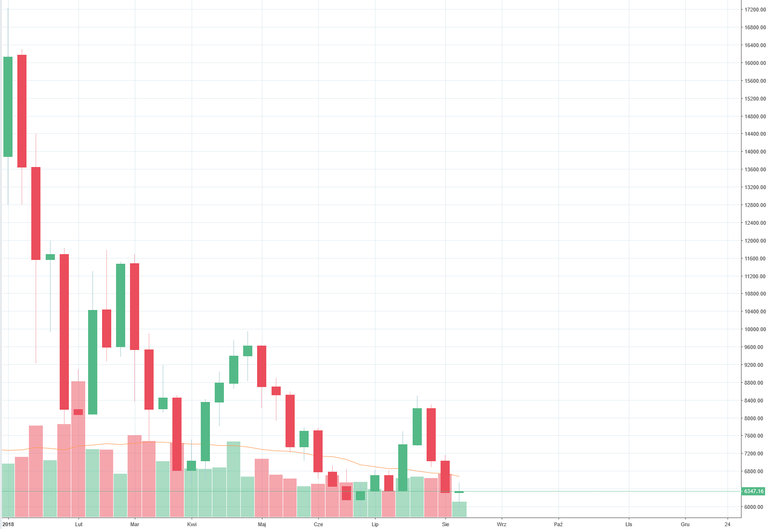
I decided to make some comparison of the charts from 2013 to 2018 on the example of Bitcoin.

2013

2014

2015


2016

2017

2018
On many forums / groups we can see the lots of various pseudo investors. They do not know why they are here and they do not understand what is going on in the market. A large part of such people do not even know what Blockchain is and when investing in a given cryptocurrency they do not know why it was created. They came here only because a colleague or brother-in-law told them that these virtual coins are turning out cool percentages, so we will throw money for a few weeks or months, multiply them and have cigarettes or breweries ...
Such people later discourage others from investing in cryptocurrencies but this is not how it should work.
Can we see something on these charts which will be useful for us this year?
Of course, yes!
August and September on almost every chart is associated with slight decreases and increases. Only in 2014/2015 there have been more rapid declines.
The end of the year is usually associated with large increases. Just look at charts 2013,2015,2016 and 2017, except for 2014.
The chart from the current year (2018) is the most similar to the one from 2014/2015. Will he repeat his scheme? No one knows this.
What, however, is worth paying attention to this year?
We are waiting for the ETF decision. It was moved to September 30, but a large number of people believe that this time the decision will be postponed and only in the beginning of 2019 ETF will come into force. However, we can not say this at 100%. Let's do our work: slowly accumulate and dig cryptocurrencies. We have a discount, use it. Do not wait until the last minute, you never hit the hole and if you make a mistake about a few % and the market will move you will regret it more than if you bought a little more expensive.
I greet you warmly and wish you the best purchase and patience ✌😎🤗
Of course, yes!
August and September on almost every chart is associated with slight decreases and increases. Only in 2014/2015 there have been more rapid declines.
The end of the year is usually associated with large increases. Just look at charts 2013,2015,2016 and 2017, except for 2014.
The chart from the current year (2018) is the most similar to the one from 2014/2015. Will he repeat his scheme? No one knows this.
What, however, is worth paying attention to this year?
We are waiting for the ETF decision. It was moved to September 30, but a large number of people believe that this time the decision will be postponed and only in the beginning of 2019 ETF will come into force. However, we can not say this at 100%. Let's do our work: slowly accumulate and dig cryptocurrencies. We have a discount, use it. Do not wait until the last minute, you never hit the hole and if you make a mistake about a few % and the market will move you will regret it more than if you bought a little more expensive.
Wow interesante : )
Thanks 👍✌🙂