What Are The Support and Resistance Points? How Are They Used?
Support and resistance points are most important subjects of technical analysis. People who want to learn technical analysis, should understand that subject well. The person who works on technical analysis or just invests in exchange market, needs to know that. Support and resistance points help us to understand where to buy, where to sell, how long will the fall continue or where will it turn back.
Resistance: The level which is difficult to exceeded by rising price. It can’t be exceeded mostly.
Support: The level which is difficult to reduce by falling price. It can’t be reduced mostly.
To sum up; support and resistance points are indicators which give ideas to investors about next move of the price. Although these indicators are accepted as assistants in technical analysis, they are most basic indicators while construing the graph. 

How To Draw Support and Resistance Lines?
Actually the most simple way to draw is using the top and the bottom points in the graph. You can see the top and the bottom points easily. We need to draw lines between top points or between bottom points. The more points that our line contains the easier we will be sure that the levels are support or resistance levels!

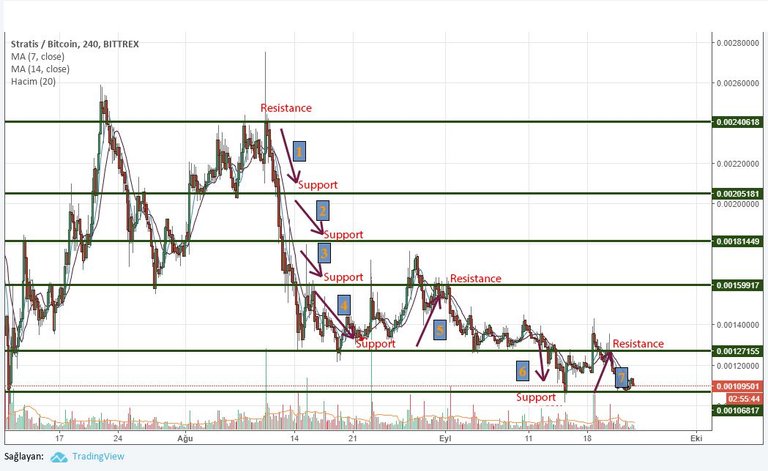
 Lets try it on an example. I have specified the actions with numbers. At first I drew lines which touch a lot of points. The one that can be understood easily is on 159.000. The price touched there but couldn’t pass. We draw our lines there. The lines that under the current price are our support points and the lines that above the current price are our resistance points. A support point can turn into a resistance point or a resistance point can turn into a support point. For example If a price which breakes the resistance, stays above the resistance permanently, the resistance that was broken by the price, will be our support. As an example you can check the action four. At first, the point was a support for us but when it breakes down, and turns up, you can see it as a resistance on action 5.
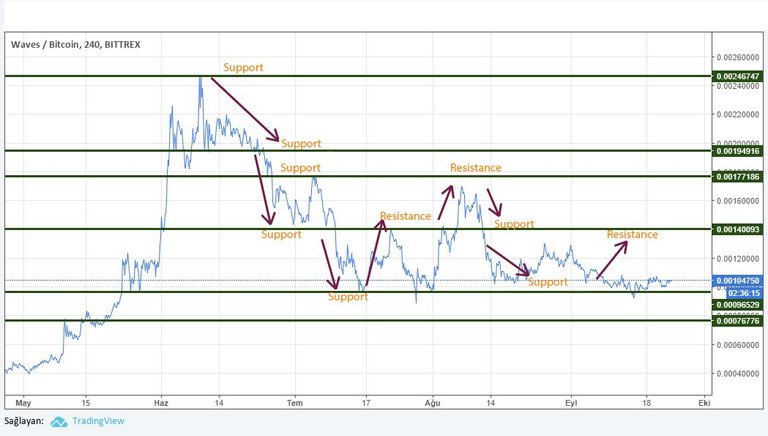
 Lets make another example for you to see more clear. We are looking to the graph on 4 hours. We draw our lines to the places which has been tops and bottoms a few times. If it is more than our current price, it is our resistance. If it is lower than our price, it is our support.

Our advise to day-traders: You can make some profit by support and resistance points. Your strategy should be; sell when it reaches to resistance, buy when it drops to support. 
You can join our telegram channel: https://t.me/cryptodrivers