Technical analysis can be extraordinarily helpful by providing you insight on when the best time to buy or sell a currency is. In this post I will go over a few basic indicators that I think really help me predict when theres going to be large changes in price.
BOLLINGER BANDS:
This indicator consists of an upper band and a lower band, that follow the candlesticks path throughout the chart.
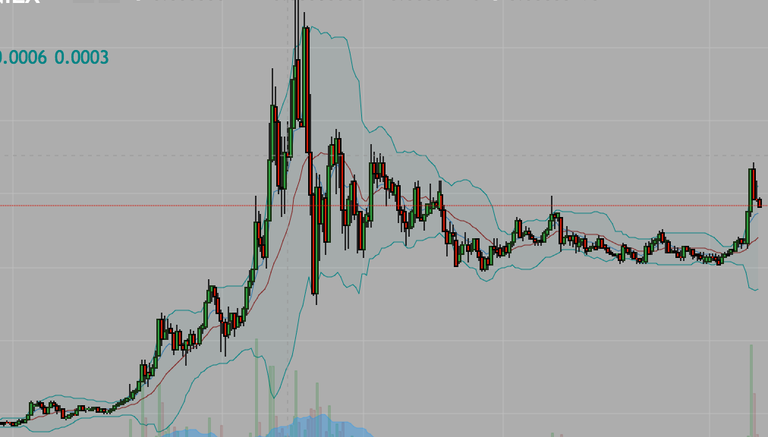
Bollinger bands help you see a couple important things. When the bands around the candlestick chart squeeze, it means there is going to be a period of HIGH volatility coming up and it is a good time to buy or sell depending on the underlying trend/news etc.
In the image below, you can see that as the bands squeeze, volatility shrinks and is then followed by a large change in price.
You can also see that if the candles are repeatedly breaking the upper band, the cryptocurrency is overbought and is likely going to pull back. if the candles repeatedly break the lower band, the currency is oversold and is likely going to move up at some point.
I think this indicator is particular good at showing when to buy for crypto's, as they experience large jumps at a time so the squeezes help you see that one of these large jumps is coming. However it is important to look at multiple indicators since one sign is not enough to predict a trend.
Relative Strength Index, RSI:
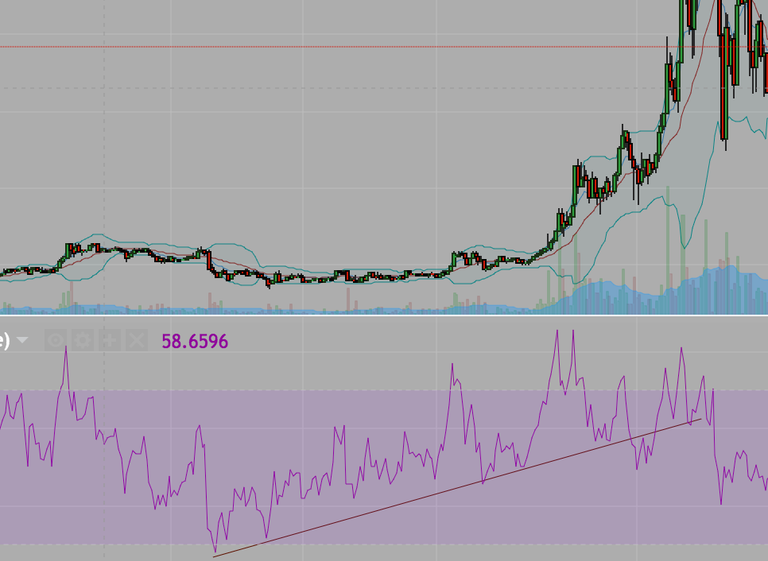
This is a momentum indicator, it shows when a currency is gaining or losing momentum. Generally above 70 means the currency is overbought and it is a good time to sell, and below 30 means the currency is oversold and it is potentially a good time to buy.
Below you can see that after the RSI dips below 30 it slowly increases as the price stabilizes or moves up. Pairing this with a Bollinger Band squeeze could be good sign that there is going to be a bullish trend forming for the crypto.

RSI is great at showing the overall trend of a currency, however you need to pair it with other indicators or you could assume the wrong trend.
Bullish Pennants:
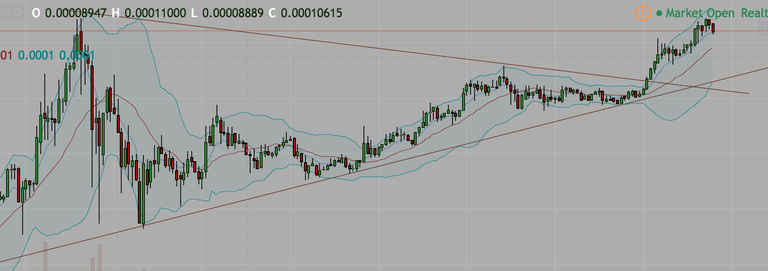
This last indicator is made by drawing a line from a recent peak and another line from a recent low or support level in the shape of a flag or pennant. Generally if the price is moving towards the point of the pennant it could be viewed as a bullish trend.
Below you can see the price bounce around between the two lines until it hits the point of the pennant. It is there where you can see that the price spikes into a confirmed bullish trend.

This is a great indicator for a potential bullish trend and paired with Bollinger Bands and RSI can create a great arsenal for predicting trends in cryptocurrencies.
Bearish Pennant: Simply the opposite of a bullish pennant, a good indicator to sell.
When to Buy?
RSI had dipped below 30 then increases
Bollinger Band Squeeze
Bullish Pennant Forming
When to Sell?
Decreasing RSI above 70
Candles repeatedly break upper Bollinger Band
End of Bearish Pennant
Hopefully you found this tutorial on technical analysis helpful! Comment on how you feel about it, hit me with a follow and an upvote if you liked it!
Check out my recent articles using this analysis predicting todays Ripple and STEEM spikes.
https://steemit.com/steem/@nschairer/steem-s-price-is-about-to-launch
https://steemit.com/ripple/@nschairer/3aznwz-ripple-explosion
All charts created on Tradingview.com
Hey. Great article! I'm just starting out trading cryptocurrencies with a small pot, I've still got my training wheels on, before making a larger investment. After a month of making dubious decisions/trades I have only just started moving into profit. The analysis techniques in this article, along with some YouTube tutorials on Fib Retracement have been a big part of seeing me finally making successful trades! Thanks nschairer