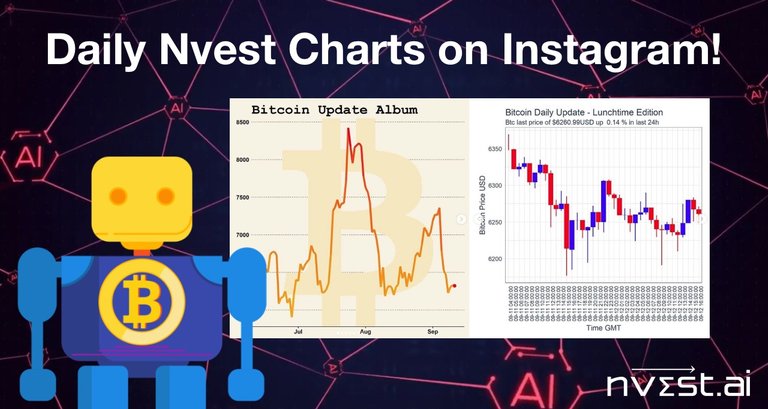
Would you like to have a look at the awesome crypto charts that @nvest posts on Instagram daily because this might be an easier way for you to understand the market than using classic technical analysis?
Last month we wrote a post that explains how to read these charts and you may want to read it and watch the video. It is called "Instagram, Twitter and Discord Nvest Charts Explained!" and we are confident this will be useful for you.
Daily Nvest Charts on Instagram!
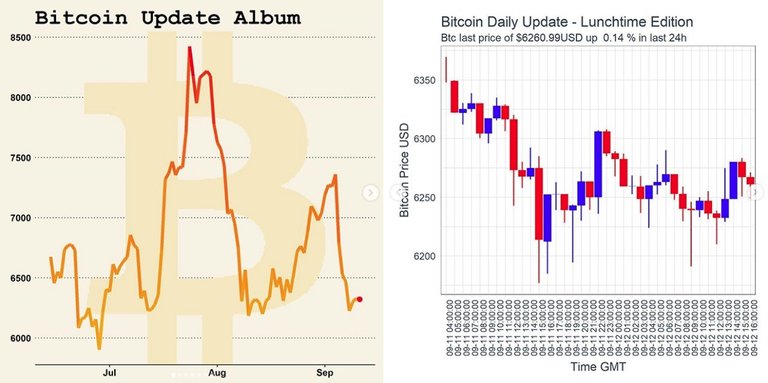
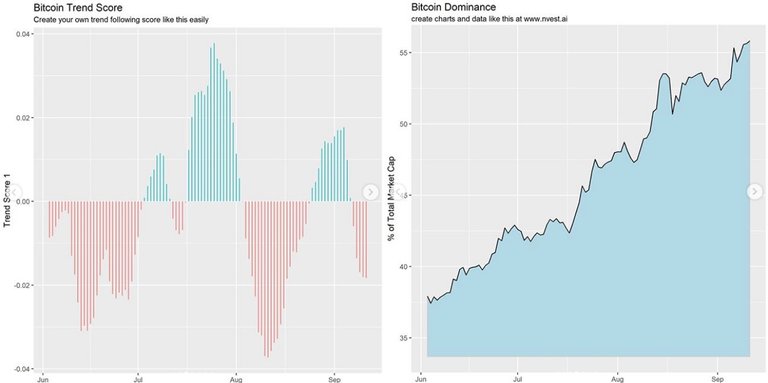
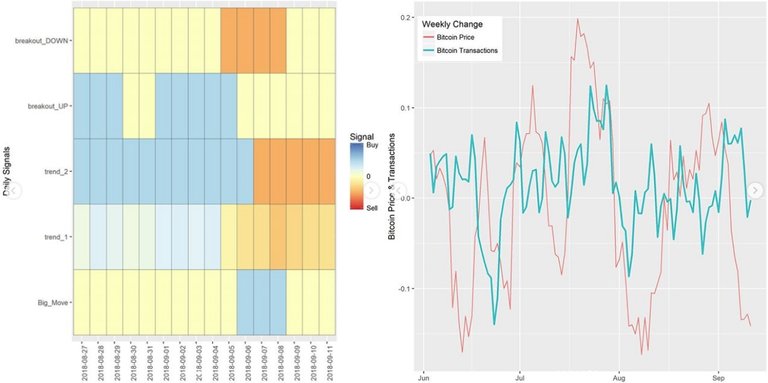
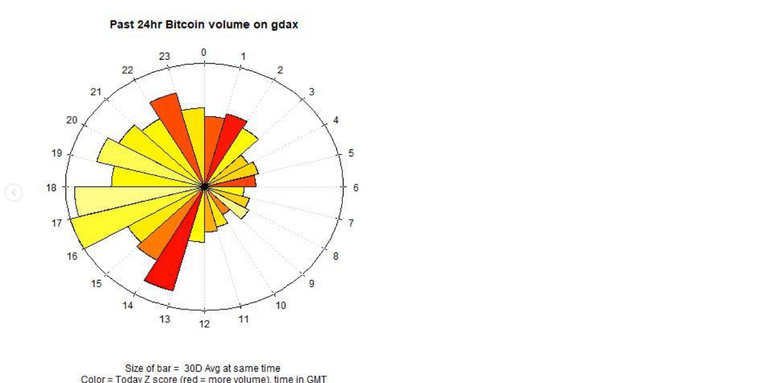
Nvest posts daily on Instagram three updates, which are: a "Bitcoin daily update," an "Ethereum update" and a "Crypto Biggest movers past 24h." There are 7 charts for each update and we are showing you in this post the latest that were posted 10 hours ago.
You can see the latest Nvest charts on Instagram here: https://www.instagram.com/nvestai/
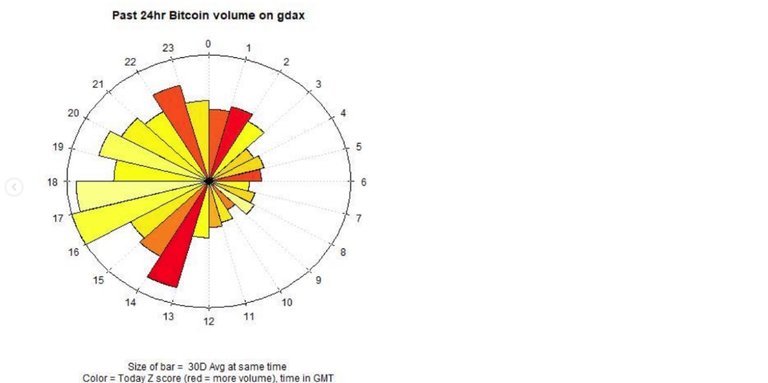
Bitcoin daily update
Trend: LongTerm Trend is DOWN since 2018-02-10. The last bar was a intermediate swing breakout to the upside and in the past 5 bars we had an intermediate swing b/o to the upside. Price action is neither overbought or oversold.
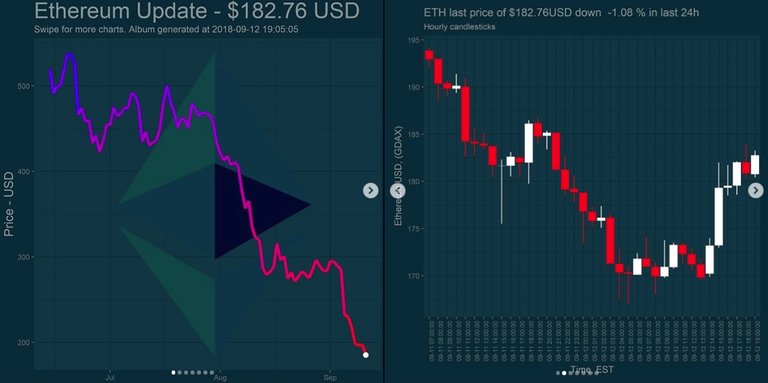
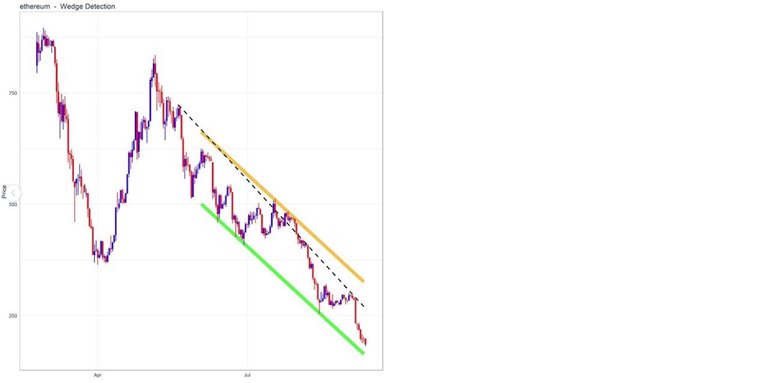
Ethereum update
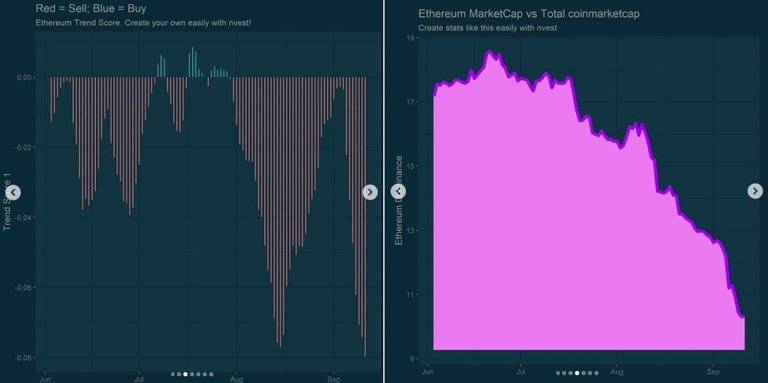
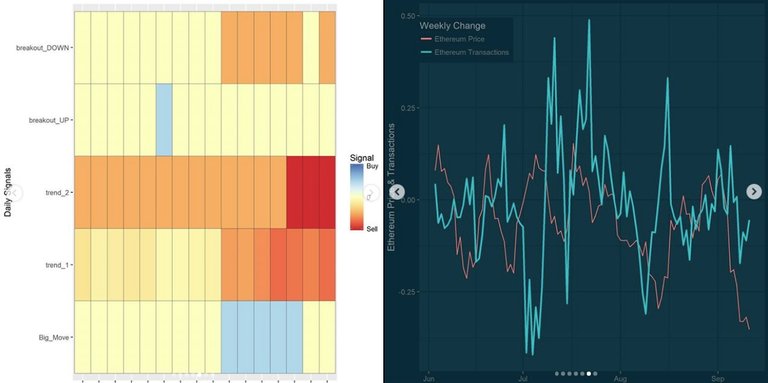
Trend: LongTerm Trend is DOWN since 2018-05-23. The last bar was a short term swing breakout to the upside and in the past 5 bars we had a ST swing b/o to the upside. Price action is neither overbought or oversold. Analyze crypto using AI with @nvest and join the revolution.
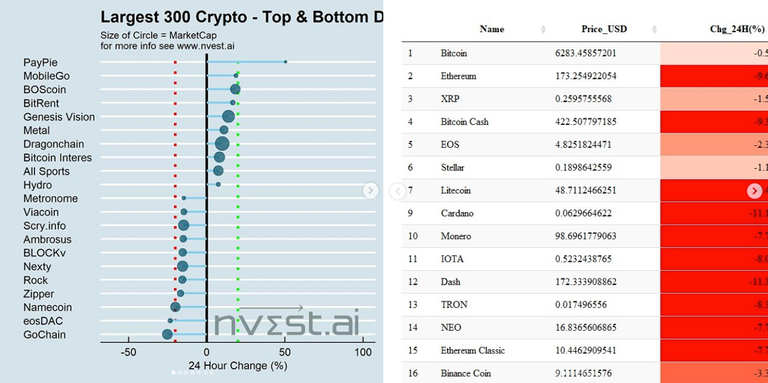
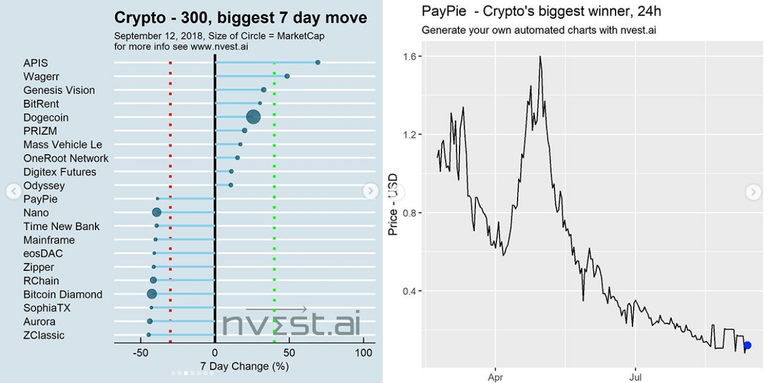
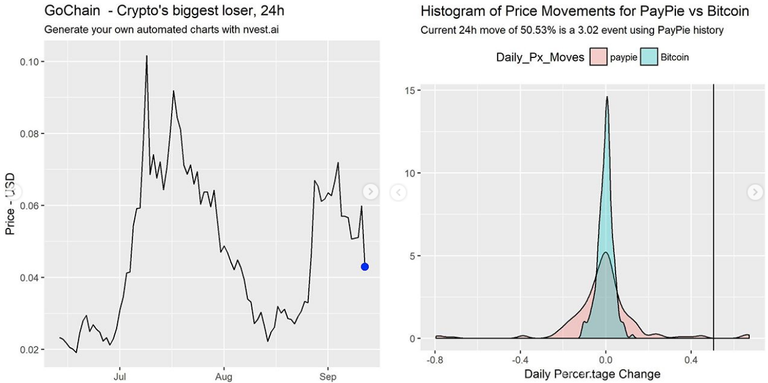
Crypto Biggest movers past 24h
Size of the circle = marketcap.
Would you go to Instagram at https://www.instagram.com/nvestai/ and follow us there because we are sure you are going to like seeing the charts daily?
We hope that you like these crypto updates.
Would you upvote this post and follow us because this will encourage us to write more articles like this one?

Crypto data & analytics powered by Machine Learning and Artificial Intelligence.
Nvest.ai is helping crypto traders and investors make better decisions with next generation tools and leading them to the next level.
Visit our website: http://nvest.ai
