BTC is currently ~10% down for the day. This drop should provide entry points for both short-term swing trades and long-term speculative trades.
Support & Resistance
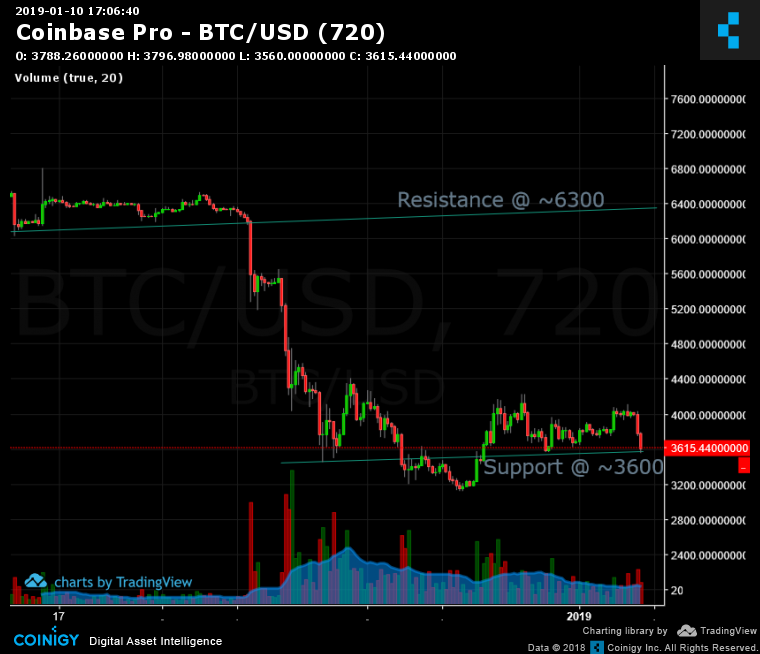
The 3 month chart shows resistance at ~$6000-6300, and support is shown at $3600. Therefore, those looking to enter a bullish trade on BTC, should place orders below $3600 ($3300-3500, ideally). This conclusion holds only if the support holds at $3600. If prices break lower (below ~$3100-2900), exit short-term bullish trades as prices could likely fall to the next support at $2200.
Those looking to exit a short term bull play, should do so at either above $5000 (the breakout line as drawn from a weekly chart), or above $6100 ( the next heavy resistance level).
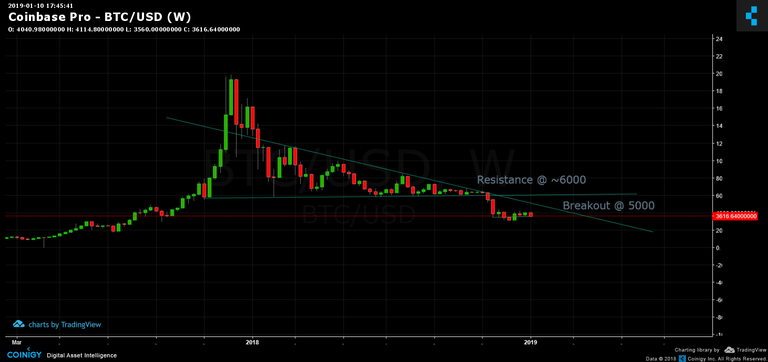
Those looking to initiate a swing trade are looking for prices to breakout at above $5000 (with heavy volume). If strong volume exists at $5000, it is likely that prices will quickly swing to the next resistance level found at $6000.
A breakout at $5000, and subsequently at $6300, will create a new trend (prices could increase rapidly). The next obvious resistance barrier from the chart and psychological barriers will be at $8000 and $10000.
I'll continue to monitor breaks in trends, and update you as necessary.
Happy Trading!
PS
Disclosure: I am long BTC, and may initiate long positions over the next 24-48 hours.
Congratulations @psteemy! You received a personal award!
Click here to view your Board
Do not miss the last post from @steemitboard: