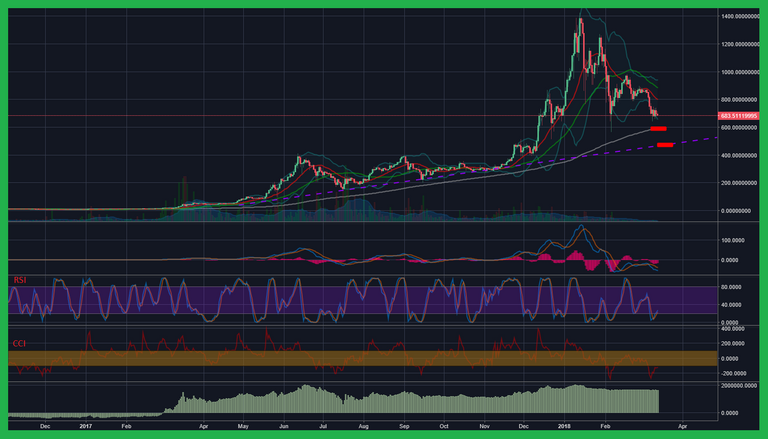
I've been patiently waiting in the sidelines for Ethereum. Falling from 1400 to 600, it was tempting to pull the trigger even for a short term swing but the move down literally looked like a vertical wall in late Jan 2018 to early Feb 2018.
At it's current price, the pattern sure looks like a head and shoulders but technical analysis pattern setup can't be heavily relied on with cryptocurrency. But by drawing a base trend line, we can see that it has room to fall below the 200-day ma which is currently at the 600 level.
Whats concerning is that the indicators look weak. The CCI and RSI both look like it'll hit another low before any attempt to climb back up.

The 20-day ma is falling sharply below the 50 and looks to continue at the moment. My buy target would probably be after price breaks or at earliest when it touches the 200-day ma but ideally a better buy target would be at the base trend line area and usually the volatility causes it to poke through the bottom possibly making a hammer candle before a pivot.
Catching the absolute bottom is difficult but it is exhilarating when it happens. As I expect the price of eth to continue to fall, I'll be watching within the coming days for a good buying opportunity along with a reversal confirmation especially if the overall market conditions seem favorable.
Disclaimer: All statements and expressions are opinions, and not meant as investment advice. Information provided in this post is not personal investment advice and should be used as informative or entertainment purposes only. Seek guidance from a professional investment advisor or due your own due diligence before trading or investing.