The article in a nutshell
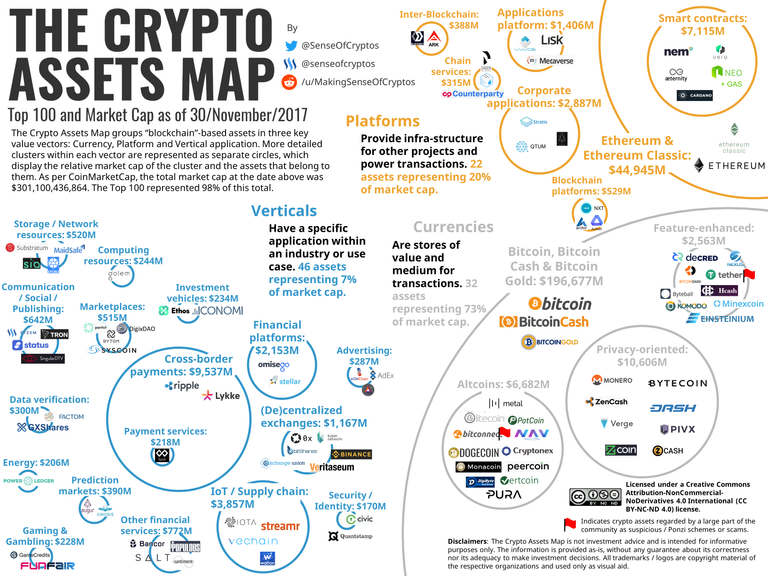
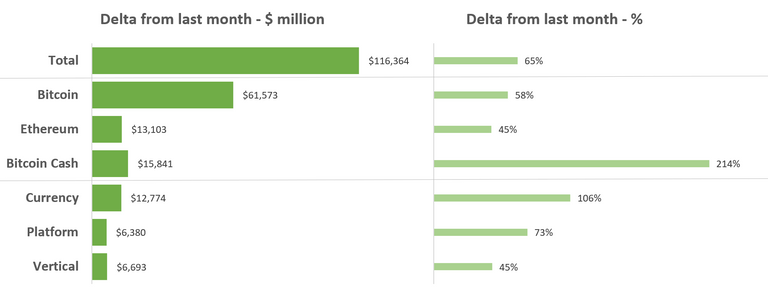
The growth in market cap during the month of November/2017 was nothing short of impressive - $118 billion growth, or 65% compared to October. The Crypto Assets Map shows that the clusters with the most significant changes were in Chain Services and Blockchain Platforms (Platforms) and IoT/Supply Chain (Verticals). If you want to understand what The Crypto Assets Map is and why it was created, I recommend reading the article that introduced it. Feel free to share The Crypto Assets Map – but remember: this is not investment advice and is provided as-is, without any guarantee about its correctness nor its adequacy to make investment decisions
Disclaimer: this is not investment advice and I am not your financial advisor. You are the only responsible for making the due diligence of any asset you are interested in investing and the only responsible for this decision. In no event I hold any accountability for your own investment decisions. This information is provided as-is, without any guarantee about its correctness nor its adequacy to make investment decisions.
The November/2017 update
First things first – so here is this month’s update:

As usual in the cryptospace, November was another eventful month. Below just some highlights, though certainly much more has happened:
• Bitcoin's SegWit2x fork was cancelled
• Bitcoin reached – and busted – the USD 10,000.00 level
• Another fork of Bitcoin came to existence – Bitcoin Diamond
• The Parity wallet hack caused some $160 million worth of Ethereum inaccessible – and as of time of writing no solution to the situation has been agreed yet
• New scams hurt investors – e.g. Confido and online Bitcoin Gold wallet
Concerning the map itself, we implemented some improvements this month, listed below. As mentioned when we introduced the map, it is a living document that will evolve together with the cryptoassets themselves. This month we saw improvements both in how some clusters are defined and in how some assets are classified. We plan to highlight these changes whenever they occur, so that they are easily understood and recognized.
• Assets that moved cluster: Byteball and Cardano
• New category created: Chain Services, replacing the more restricted (Platform) Oracles
The churn rate in the top 100 was even higher than last month, with 17 crypto assets replaced. The following assets dropped from the top 100:
• Aragon
• Bitdeal
• bitqy
• Dentacoin
• Edgeless
• FairCoin
• Groestlcoin
• I/O Coin
• Kin
• Loopring
• MCAP
• Monaco
• Neblio
• NoLimitCoin
• iExec RLC
• SmartCash
• TaaS
Replaced by:
• Peercoin
• Storj
• Bitcoin Gold
• PowerLedger
• Exchange Union
• Raiden Network
• Cryptonex
• Einsteinium
• Santiment
• MinexCoin
• Streamr DATAcoin
• Achain
• ZenCash
• Quantstamp
• Substratum
• PotCoin
• Counterparty
In terms of value, the graphs below summarize the changes from last month. To make it easier to understand shifts, the top 3 crypto assets are listed along the remaining assets clustered per their main value vectors of Currency, Platform and Vertical application.
Final words
For those following the market on a daily basis, it is easy to lose perspective of how much growth happened in only one month. That is the intent of The Crypto Assets Map: to help bring this perspective back, by tracking how different clusters evolve over time. I would love to know your thoughts and which insights you might have gotten from it – so, leave your comment!
Updating The Crypto Assets Map takes a significant effort. I would like to know whether you found it valuable - so please upvote in case you got value from it!
