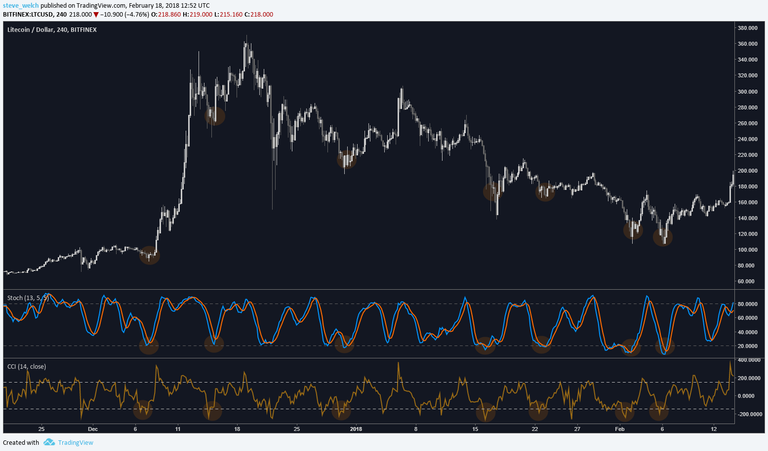
This article outlines the basis for a simple swing trading strategy using oscillators. The idea being that you can take advantage of short to mid-term swings in price, allowing you to maximize your profit potential. I have used a variation on this for FX trading and have now applied it to crypto. I have found it to return better results in these markets.
For the purpose of this example I will only demonstrate buy/long signals but the same can be applied to shorts also. I am using recent price data and not cherry picking charts. it is important to do your own back testing of any strategy before applying it to your trading.
So let's begin.
Chart: LTC/USD
Timeframe: 4Hr
Stochastic: 13,5,5, 20/80
CCI: 14, 150/-150
This method works best on a 4Hr time frame but is just as valid on the daily chart. You could apply to a 1Hr for more aggressive trading but you will lose reliability.
The Stochastic is set to a smoother curve to eliminate false signals, also reduces the lagging factor of the indicator.
Standard settings for the CCI are 20 period but I have found that 14 will open up more entry signals.
As with any trading strategy we need a decent amount of volatility in order to return a profit. Also, the direction of the trend is not all that important here.
The basis of the strategy are as follows;
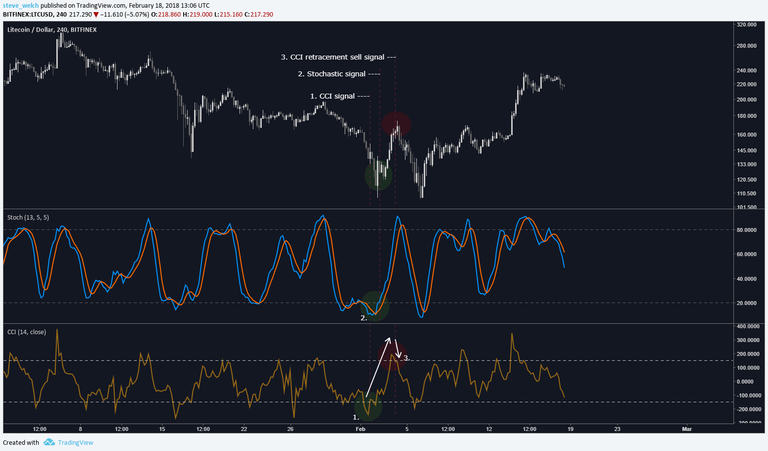
Enter long when the CCI spikes below oversold and the Stochastic follows with a break above oversold.

Condition 1:
The CCI breaks below the -150 line and retraces above it (forming a downward spike).
The larger the spike the stronger the signal.
Condition 2:
The stochastic then makes its bullish cross (The K line crosses over the D line).
We do things a little different here. The K line (Blue) must touch or be below the oversold line before making the move over the D line (yellow).
Normally you expect both lines to fall below oversold yet here it is not required.
Once the Blue has crossed the Yellow and is NOT in oversold area you can now make you entry.
It may be a good idea to look for bullish reversal candles or a smaller time frame to time your entry better. This all depends on the individual trading style.

Condition 3: Exit
Timing your exit is important. Here we look to the CCI to indicate when to close the trade.
This is the reverse of condition 1. Once the CCI moves into overbought, spikes and retraces to the 150 line we exit from our position.
And that is it. I hope you like it, it has served me well in the past and may do the same for you. Please do your own testing and let me know how it works out for you.
I cannot guarantee results but if you like my strategy then please show some love by upvoting, commenting, and following!
Out of curiosity, have you tested the strategy with other USD pairs?
I've been trading it for a while now so yeah. I only used LTC as that has been giving best results recently.
Will give it a test, thanks. Lets see if usd pairs show similar results for other similar capped projects. Would be super interesting if some correlation exists