For a while, I have been assembling a series of models dedicated to accomplishing two tasks:
- Forecast the future price of bitcoin / any currency
- Zero on appropriate times to take action (buy, sell)
In the process, I've tried many, many things.
You can categorize the bulk of preexisting models as such:
- Network-based - activity on the network dictates value
- Production-based - what does it cost to produce 1 bitcoin and in turn, what is it worth?
- Money supply or equation of exchange - valuing cryptoassets based on their utility as a currency
By far, the most effective of these has been network-driven models, and it makes sense as to why.
Where other models are specific on only certain components of their utility, the network is all-inclusive. The network is where the rubber meets the road:
- Hardware to support
- Real-estate housing the hardware
- Energy production
- Jobs / labor
- Fiat flowing in for direct exchange
...and so on.
The vast majority of these models are looking at a handful of data sources, which are typically a combination of the following:
- Number of transactions
- USD value of transacitons
- Number of wallets
Today I wanted to share someone else's model, prior to sharing my own. It is logarithmic regression-based, and has already proven itself several times over. Like most models that fit into the "network" category , it is using a form of Metcalfe's Law, although different data on all coins selections.
Trendlines are essential for forecasting yet broad in their scope. While the model has output a relatively accurate prediciton for future prices, it remains in a broad range, which is typical of these kinds of calculations.
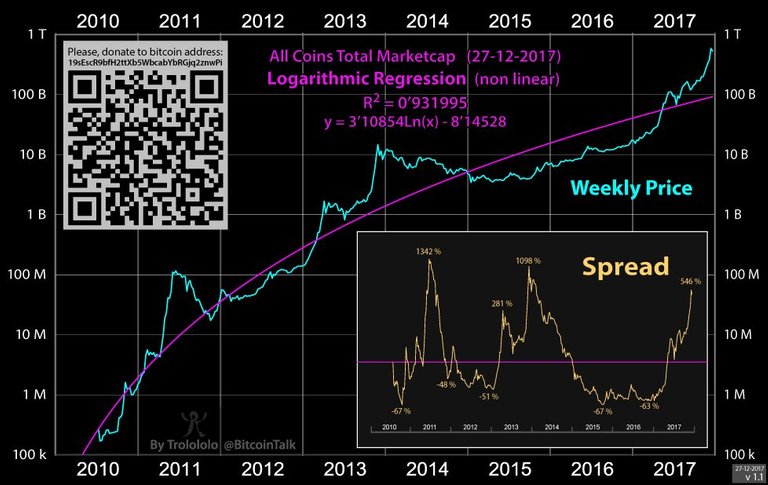
First, here is the last model posted by the author covering all coins. It was published on December 27th and attempts to identify the fair value total market cap. Bear in mind that the regression line will adjust as time carries on. In other words, should values get parabolic, you're going to see the regression line self-adjust right along with it, but to a fair degree.

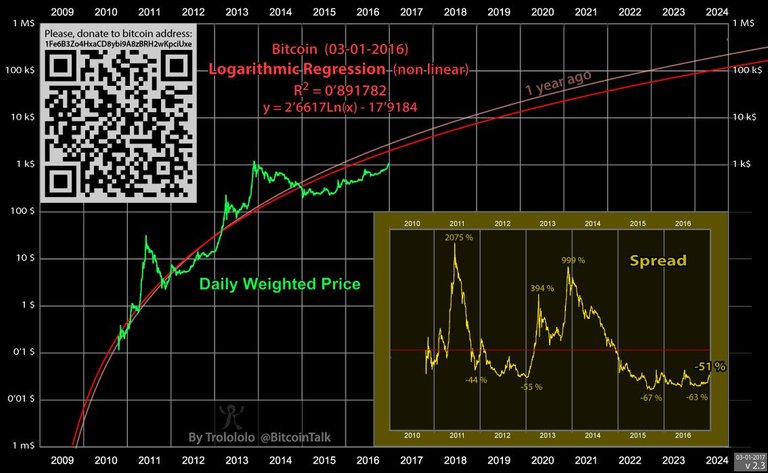
And here was the last chart on Bitcoin (published almost a year ago).

These models are not that difficult to create, once you understand them.
As noted by the spread, you can see how far off base prices can get with the regression line. This is typical, and why a model like this is best used in broad scope only. For buy and sell triggers, more is needed. It is a topic I will cover at a future time.
Regardless, the model has already correctly predicted (conservatively) where prices ultimately ended up toward the end of last year. Again, I have my own methods here, but without looking at these, we have no where to start.
Sources as follows:
Total market cap: https://bitcointalk.org/index.php?topic=2000218.0
Bitcoin: https://bitcointalk.org/index.php?topic=831547.0
Disclaimer: I am not a financial advisor. This is not financial advice. My tongue holds no value. You are in control. You are smarter than you realize.
I'm brand new to Steemit and could use your upvote! Thank you!!!
Interesting.
This post has received gratitude of 2.03% from @appreciator courtesy of @swinn!
If you believe this post is spam or abuse, please report it to our DiscordYou got a 2.30% upvote from @upmyvote courtesy of @swinn! #abuse channel.
If you want to support our Curation Digest or our Spam & Abuse prevention efforts, please vote @themarkymark as witness.
If you believe this post is spam or abuse, please report it to our DiscordYou got a 6.58% upvote from @ipromote courtesy of @swinn! #abuse channel.
If you want to support our Curation Digest or our Spam & Abuse prevention efforts, please vote @themarkymark as witness.