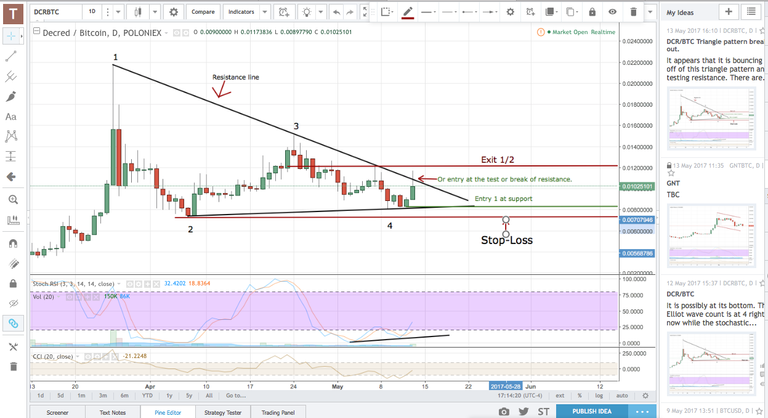
It appears that it is bouncing off of this triangle pattern and testing the resistance. The reason I like this chart is because it is working on wave 5 according to the Elliot Wave Theory.
There are two entries - entry 1 and entry 2.
*Entry 1 is at the support incase the price decides to be tricky before the potential break out.
*Entry 2 is the text book entry - The break of resistance.
I take the idea of having a mental stop loss extremely serious and so should you.
This is the live link to the chart on TradingView:
https://www.tradingview.com/chart/DCRBTC/bGUAlXDX-DCR-BTC-Triangle-pattern-break-out/

It took a few days but I sticked to the rules. Patience is key. I hope who ever saw this alert are making some profits.
The crypto market has jet failed me.
Congratulations @theglitch87! You have completed some achievement on Steemit and have been rewarded with new badge(s) :
Click on any badge to view your own Board of Honnor on SteemitBoard.
For more information about SteemitBoard, click here
If you no longer want to receive notifications, reply to this comment with the word
STOPIf you want to support the SteemitBoard project, your upvote for this notification is welcome!