If you've looked at my technical analysis before, you'll know that I like to keep my drawings and indicators to a minimum. This week is no exceptions - just 2 charts this week!
Last week my picks hit their stops, (sorry about that). I'll persevere and learn from my mistakes!
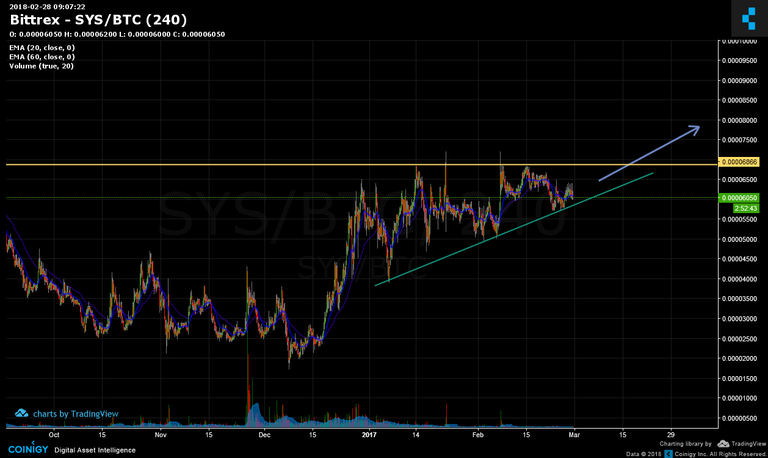
SYSCoin
SYS has appeared in a previous edition of Wednesday Winners and I think it'll be going up again. Another strong formation of an ascending triangle could see a nice profitable jump if it, (and only if) it passes the 6850 sats mark.
BUY: <6950 sats (contigent upon a break above 6850)
TP: 8040 sats
SL: 5700 sats
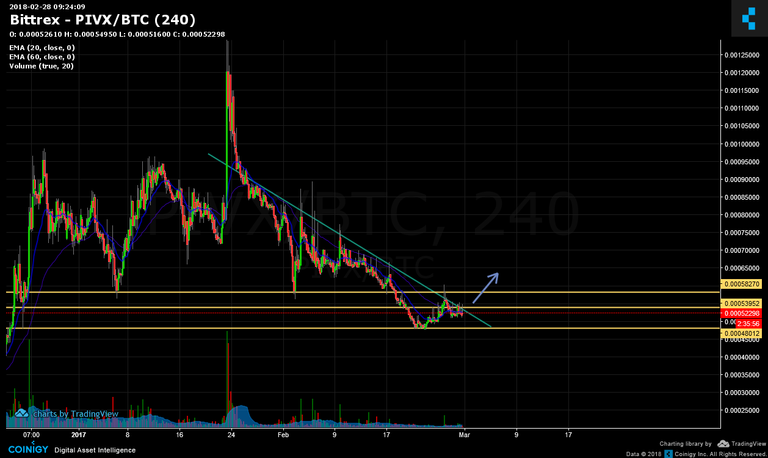
PivX
PivX has been trending down for a little while and seems to have been adhering to the green pictured trend line. Given the faster drop from around the 17th Feb, and the subsequent climb, we're seeing a gentle *123 Bottom forming which may indicate a turn around. I want to see 2 things, before I buy though, 1 - at least 2 green candles above the green trend line and 2 - a closed candle above the "2" mark, (56300 sats).
BUY: 56500 sats
TP: 67000 sats
SL: 50500 sats
Yes indeed - the channels are there for syscoin and if it breaches the lower trendline... I don't care. I'm certain when we look back after the next three years, all of this part of the long term chart will look like flatline.
The PIVX chart is a good read of the 1-2-3 bottom - there are a lot of them shaping up across the board now, so it's time to scale in a bit, and then wait it out.
Many of these markets will experience large spikes in prices, and having a percentage of your hodlings set for sale way above the market should be considered.
I like syscoin chart. Usually ascending triangles break out through rising way. So we can follow syscoin price. Thanks for share. Have a nice day.
Cheers, I agree - I've been wrong before, but looks like a breakout is closer than ever!
Hi, great post, worth a follow. Looking forward to some more of your stuff.