The Reserve Risk Multiple (RRM) is a lesser-known yet historically reliable cryptocurrency technical indicator. Recently, the RRM has signaled a potential onset of a significant bullish trend in Bitcoin's price. This article will explore how we can use and combine the RRM with other key metrics to gain a more comprehensive view of the market.
What is the Reserve Risk Multiple (RRM)?
The RRM is a long-term indicator that compares the incentive to sell at current prices with the reluctance of long-term holders (HODLers) to liquidate their positions. A low RRM indicates strong conviction among HODLers, while a high RRM suggests the opposite. The RRM is calculated by dividing the daily value of the indicator by its 365-day moving average.
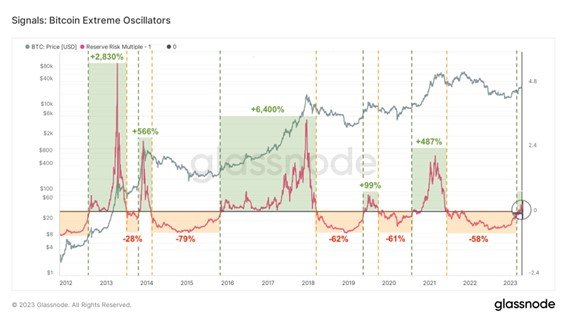
RRM chart extracted from the original article: Lesser-Known Bitcoin Indicator Signals Onset of Major Bull Run (Omkar Godbole)
RRM History and Its Relation to Bullish Trends
According to Glassnode data, the RRM has crossed above zero and turned positive for the first time since October 2021. In the past, these positive RRM crosses have preceded significant bullish trends in Bitcoin's price, such as in 2012, 2013, 2015, 2019, and 2020.
Combining the RRM with Other Metrics
While the RRM is a valuable tool, it should not be used in isolation. Investors and advanced analysts should combine it with other metrics and analyses to gain a more comprehensive market view. Below are some possible combinations and how they can help make more informed decisions:
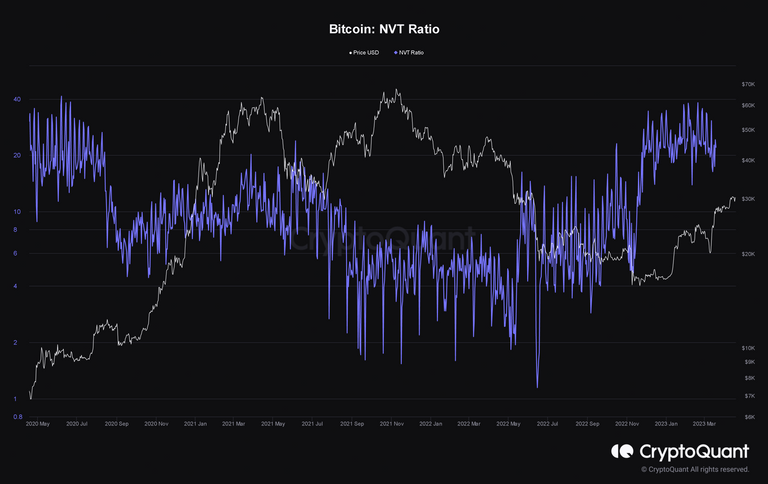
- RRM and NVT Ratio: The NVT Ratio compares Bitcoin's market capitalization to its transaction volume. By combining the RRM with the NVT Ratio, a broader view of market sentiment can be obtained. For example, if the RRM is low and the NVT Ratio is also low, this could indicate that the market is undervalued and that there is real economic activity backing Bitcoin's price.
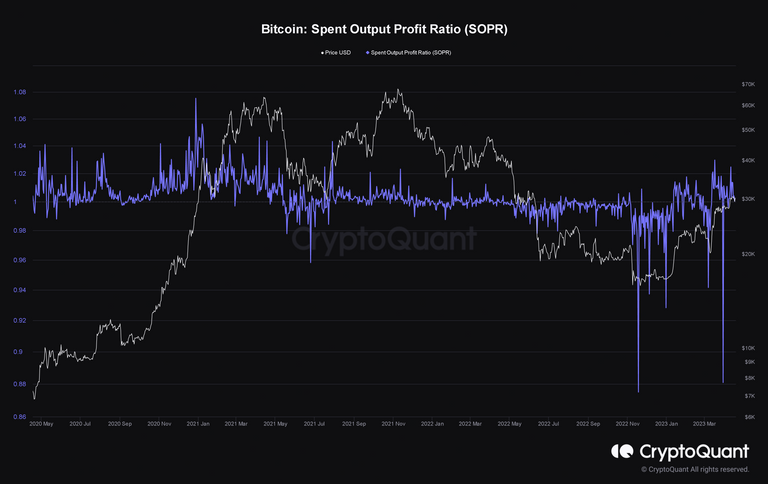
- RRM and SOPR: The Spent Output Profit Ratio (SOPR) measures the profitability of coins sold. By observing the RRM alongside the SOPR, periods when investors may be taking profits or accumulating positions can be identified. If the RRM is high and the SOPR is also high, this may indicate that investors are taking profits and could be a good time to consider selling.
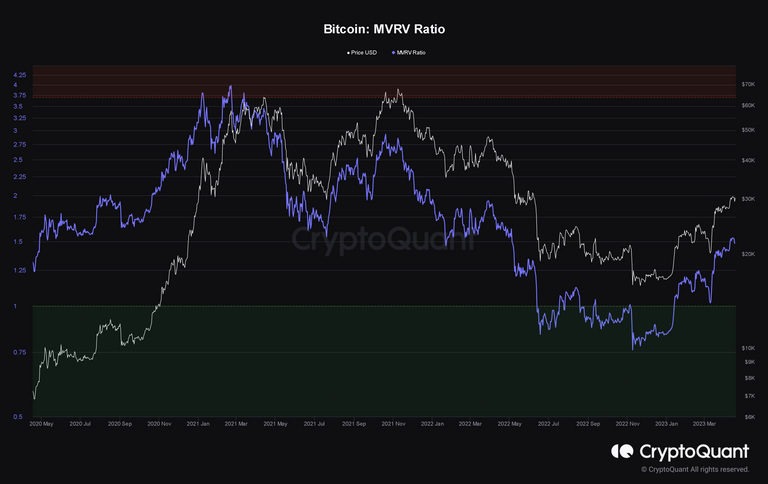
- RRM and MVRV: The Market Value to Realized Value (MVRV) compares Bitcoin's market capitalization to its realized value. Realized value is an adjusted market capitalization measure that takes into account when coins were last acquired. By combining the RRM with the MVRV, potential entry and exit opportunities in the market can be identified. For example, if the RRM is low and the MVRV is also low, this could indicate that the market is undervalued and might be a good time to accumulate positions.
Practical Approach: Using CryptoQuant, Messari and Glassnode for RRM and Other Metrics Analysis
Both Messari and Glassnode are cryptocurrency data analysis platforms that provide access to a wide variety of metrics, including the RRM. To make the most of these tools and effectively analyze the RRM and other key metrics, a subscription is required to access the indicators on Glassnode. However, they also offer free trials that allow for temporary access at no cost.
It's worth noting that, while a subscription is necessary on Glassnode to access the RRM indicator, for the other indicators, you can resort to an excellent free alternative that you may already be familiar with: CryptoQuant. This platform offers a wealth of valuable metrics without the need for a subscription, making it an ideal option to complement your analysis.

In conclusion, the Reserve Risk Multiple is a valuable yet little-known technical indicator that can provide useful insights into market trends in the Bitcoin space. By combining the RRM with other key metrics and using data analysis platforms like Messari and Glassnode, a more comprehensive market view can be obtained, and better-informed investment decisions can be made.
As Bitcoin appears to be entering a new bullish trend, these tools and metrics will be crucial for maximizing investment opportunities and staying on top of market movements.
Thank you so much for taking the time to read this in-depth analysis! I'm excited to share valuable insights with fellow experts and enthusiasts in the world of cryptocurrencies. If you have any advice, suggestions, or just want to say hello, don't hesitate to leave a comment.
Quote of the day:
"In the world of cryptocurrencies, technical analysis is a powerful tool, but it's important to remember that no single indicator tells the whole story. Always consider multiple perspectives to make informed decisions." - Andreas M. Antonopoulos, cryptocurrency expert and author.
Stay tuned for more insightful posts and analysis!🐝

By @vibora