Pre-requisite Knowledge: RSI, Trend Trading, Basic Price Action
A frequent problematic experience in which I encounter when trading is mixed signals in different time periods. The tutorials make it seem easy right? Using the RSI, when the value becomes greater than 80ish or so, you sell, or when it becomes less than 20ish you buy. How about trends? Don’t trade against the trend right? THE. TREND. IS. YOUR. FRIEND. These are just some of the basic tips being thrown at investors all the time. And sure, there is SOME value to that on a fundamental level but as always there are problems associated them. As hinted by the opening statement we will look at instances in which contradicting information of its own class (i.e. RSI with RSI, trend with trend) is found between the different time frames and what I personally do to adapt to the situation.
Let’s get right into this:
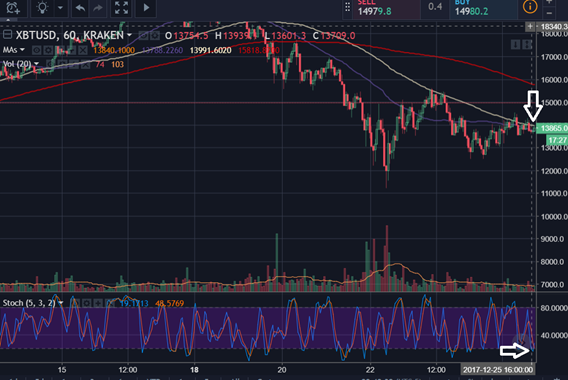
Looking at the 1 hour time frame bitcoin right now is apparently oversold on our RSI with an intuitive potential for it to go up within the next little bit.

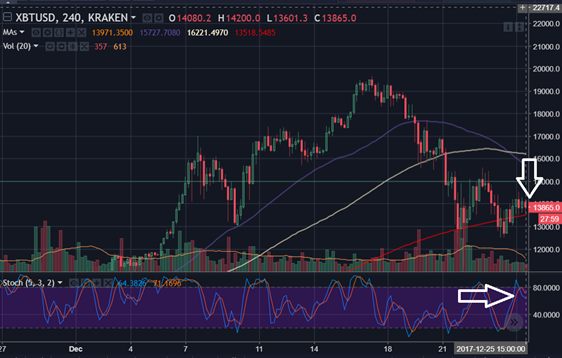
But what does our 4 hour period look? Well that looks odd, looks like it’s…. overbought, on the complete opposite end of our RSI spectrum.

So which set of information is correct? What do we do? Most importantly, how does one not completely lose it over this kind of contradiction when the tutorials make it seem so easy?
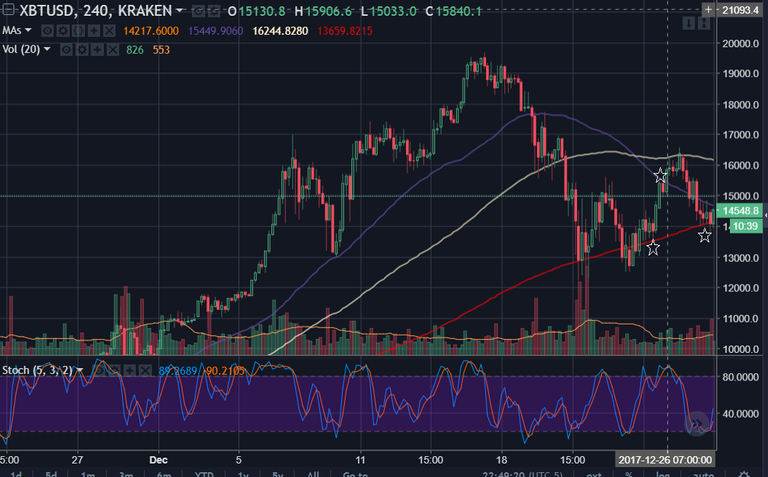
The answer to the first question is that they’re both right. As we see in later price action, the price actually swings up initially to reflect the oversold aspect of our hourly RSI, while the price then lowers much later to reflect that of the 4 hour RSI.

Obviously with 20/20 hindsight, the plan is to buy, sell and then potentially buy again at the last point marked on the chart. But we can’t change what we do in the past so let’s talk about some strategies in the moment. There’s a few things I would do in these scenarios:
- Wait for signs on both periods to align before making a trade. The greater aligned the indicators on different time scales, the better the chance of the expected outcome happening.
- Have lower expectations for results trading on the shorter time period to accommodate for the possible opposing outcome at a later time. That means investing a smaller amount of capital and be conservative of your price target.
- Use other indicators and clues. With the example above, the double bottom as well as the support of the 200-day moving average makes this a great candidate for a short term surge. Take caution though as during this time period bitcoin experienced a correction and there is uncertainty as to whether or not it could correct even further.
These concept can be pertinent to whatever kind of analysis you do. Another strong example would be to look at the different time scales for the trends that bitcoin follows. On the weekly scale, bitcoin is growing exponentially, as if there is no hindrance in sight. But looking at the daily one at this time, bitcoin is showing signs of weakness.
In conclusion, the basic strategies being taught to investors are not sufficient. Temporal contradictions like this are just one of the many problems we must learn how to deal with if we want to be successful in this field. Good luck and happy trading!
Good stuff! Thanks for sharing
Congratulations @wagnerxd! You have completed some achievement on Steemit and have been rewarded with new badge(s) :
Click on any badge to view your own Board of Honor on SteemitBoard.
For more information about SteemitBoard, click here
If you no longer want to receive notifications, reply to this comment with the word
STOP