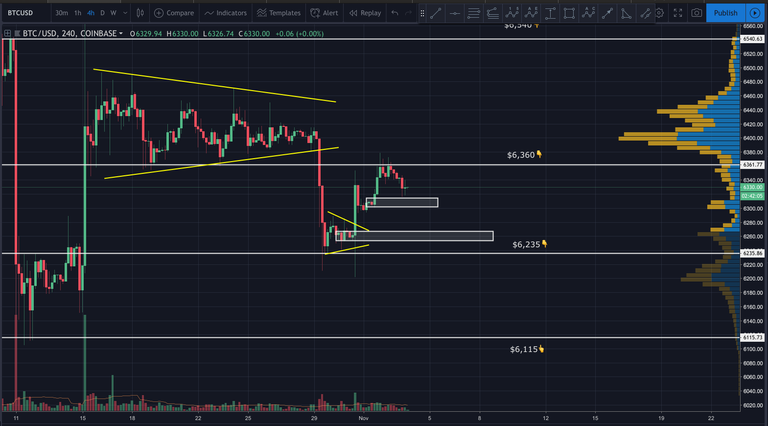
Bitcoin continues to trade within a smaller and smaller range. It was unable to decisively break above the $6,360 resistance. It’s now falling and looking for support. I wouldn’t be surprised to see a bounce somewhere between $6,300 and $6,250.

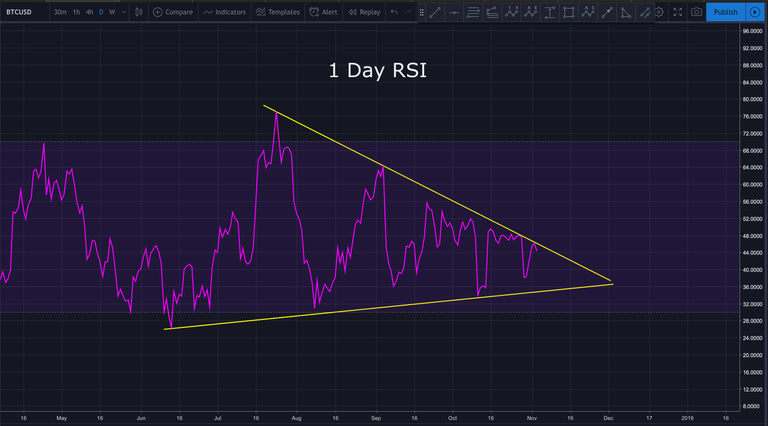
The daily RSI is also getting squeezed within a larger wedge, showing a series of lower highs and higher lows. This suggests a larger move to come over the next month.

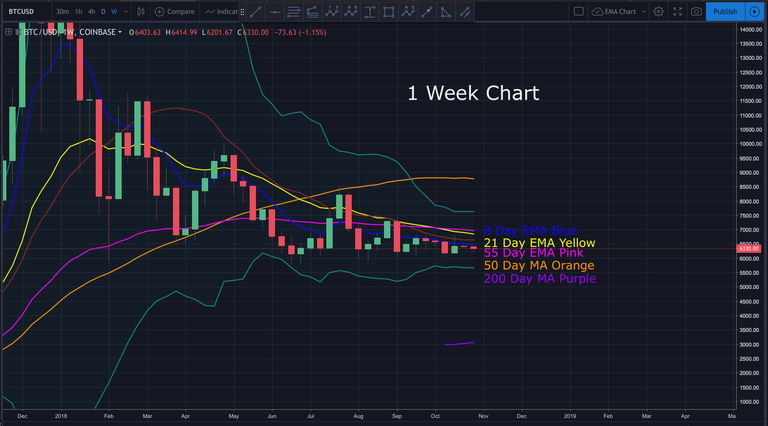
The weekly chart reveals the Bollinger bands bottlenecking, as well as the 8, 21 and 55 day EMA all converging. This also suggests a larger move to come.

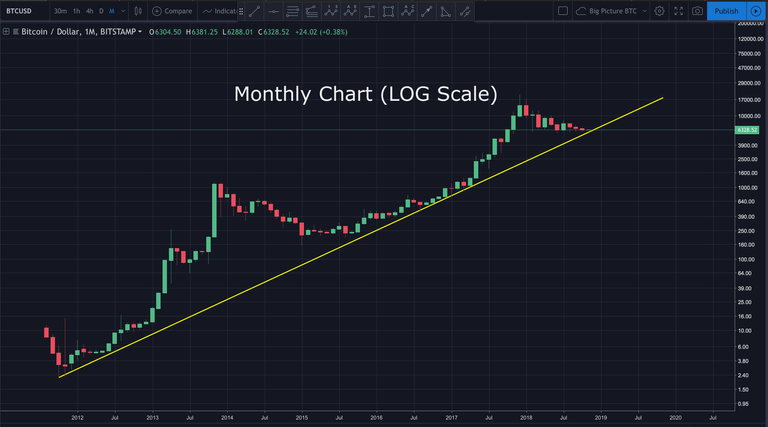
Zooming out on the monthly chart (in LOG scale), we can see price is coming up against the larger ascending support line that’s been in place since late 2011. The bull in me says we may get a very explosive bounce off this support sometime in the second half of November.

In today’s video analysis I discuss, where price may go from here, how I’m trading the market, traps to avoid and so much more. I hope you find it helpful.
Video Analysis:
If you don’t see the above video, navigate to TIMM (https://mentormarket.io/profile/@workin2005) or Steemit in order to watch.
I hope this has been helpful. I’d be happy to answer any questions in the comment section below. Until next time, wishing you safe and profitable trading!
Workin
If you found this post informative, please:

Open an Account on Binance here:
https://www.binance.com/?ref=16878853
Support the Crypto Ecosystem with Brave Browser:
https://brave.com/wor485
Twitter handle is @Workin2005 and Facebook is https://www.facebook.com/Workin2005
Published on:

by Workin2005

The monthly Log chart I truly hold close...I see it popping up ALOT more than it did a year or so ago...its the doozy. The one that really makes you believe 100k is possible.
It certainly puts things into perspective.
It's all about that long-term trendline. Everything else is just dust in the wind, but that big trendline, that's the important one! Bull mode firmly engaged.
That trendline is certainly significant.
It feels like this situation is going on forever.... yet flatlining is not an option, is it?
Sure it's an option, but if price does flatline, I doubt it'd last very long. Smart money has started to accumulate via OTC. ETF approval is likely coming in Q1 of 2019. The tech continues to improve exponentially. There's just too much interest IMO. That said, this is a brand new market. I wouldn't take anything off the table at this point.
isnt BTC above the trendline drawn from the march area? i woulda thought getting above that woulda been a bigger move up.