Hey guys, I have a trade value prediction for DGB DigiByte.

I have been studying the graphs and trends, and from what I see based on the last weeks mega pump up then dump down, I am predicting here on the steem blockchain, that DGB Digibyte will rise up between 1550-1750 SAT within the next 2-4 days,
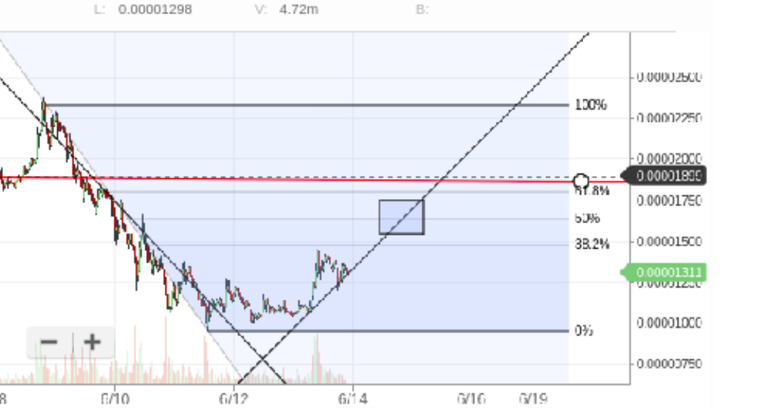
Below I have uploaded a photo of my prediction according to graphs using a very consistent fibinacci method with a triangle overlay for trends

In the graph you can see the initial rise up of DGB which surpassed the 2500 SAT mark. It leveled out a little then came tumbling back down , only now to begin trending back upwards.
In this photo I use a horizontal line to show a rough estimate where the high trend was. I also highlight the low trend with a black line. I lined out the downfall in a triangular vortex shape . then I used my fibinacci lines to find out where the 38% 50% and 62% lines would retract to.

These lines almost always hit using this method, if you don't believe me, you are welcome to try them out on any other big trend in the past,they are almost always correct, but never fool proof but its good to know for the future;)hint hint**
anyways, I opted for the 50% range, to be fair, a gave a little leadway below, towards the 38% mark, and a little grace above towards the 62%, for the challengers.
The rectangled area is my rough estimation of price valuation according the the graphs posted dates
I have personally set a sell order around 1650 SAT for a nice profit.
Now as always with these methods, you wait, and you wait, and you let it wor its algorithm.
Happy trading folks!
What you think about long term? Is going to reach 1$???
not sure about 1$, it would need a few billion dollars for market capitalization to reach that value, but a few thousand sat is not out of reach, i can easily see 5000 in next month or two
Nice post!
Thanks for checking it out! Muchly appriciated!