Wanna Stop the Violence?
7 years ago in #discussion by everittdmickey (73)
$2.76
- Past Payouts $2.76
- - Author $2.72
- - Curators $0.04
20 votes
- everittdmickey: $2.38
- deanlogic: $0.15
- vickiebarker: $0.07
- vieira: $0.03
- frankabelle: $0.03
- texagonia: $0.02
- elumni: $0.01
- dragon40: $0.01
- zacharylutes: $0.01
- geordieprepper: $0.01
- jeff-kubitz: $0.01
- mikefromtheuk: $0.01
- funbobby51: $0.00
- talhajaved8: $0.00
- sweetie4liberty: $0.00
- orionschariot: $0.00
- zavaliy: $0.00
- liquifire: $0.00
- popponayashelly: $0.00
- bukigirl: $0.00
Crazy how that works out! Once we get the results of the next census, I suspect the map will match the 2016 electoral maps even more closely!
LOL too bad there is no map of the places where police chiefs deny people gun permits the most are.
I suspect that you're looking at that map..
same thing.
I do have such a map for MA.

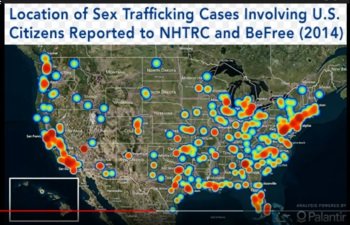
Well, a picture is worth what? ... a thousand words:

Definitely a correlation.
Violence continues
Yea certainly there is a corelation in both the pics. Lets hope all this stuff is controlled. God Bless all.
These maps show nothing other than the correlation between democrats living in urban areas and republicans preferring more rural environments while also showing the link between population density and violence.
Of course murder rates are going to be higher in cities, there are more people. That's just an objective fact.
Another objective fact is that the political affiliation of people living in cities tends to be democratic whereas rural areas are more likely to be a majority republican. (I'm making sweeping generalizations as is your post).
I support change, but this argument needs data that shows more than the correlation between two variables that don't impact one another.
my post didn't say ANYTHING...I only posted a pretty picture.
all the generalization come from within your mind.
You can tell yourself that but your picture leads everyone directly to those generalizations.
well DUH!
there might be a reason then...you reckon?
There might be a reason, yes. You're right. But the reason IS NOT that democrats live in these areas and republicans don't.
that would be an uncomfortable thought eh? For dhmikrats..
This is gold @mathiasian!