'Do Your Own Research!!!'
It's what you hear every single time you ask the internet about anything crypto or finance related, and honestly, it really is one of the best policies to follow.
The alternative, of course, is to trust the wisdom of that blog post you read, the video you watched or the collective wisdom of a comments thread... or even some loud article pushed to you by a news source you trust.

Nevertheless, it can feel intimidating, time-consuming or just downright tedious even though a lot of the time, DYOR could be as simple as skimming a web page or browsing a little data. Let me show you the pitfalls of neglecting to DYOR!
The Example
To make this really easy, I'm going to use a stock ticker rather than a cryptocurrency. Stocks tend to be valued along similar universal guidelines and don't vary as dramatically as blockchains can, but let's also have a little fun with it... so here's my choice of ticker.
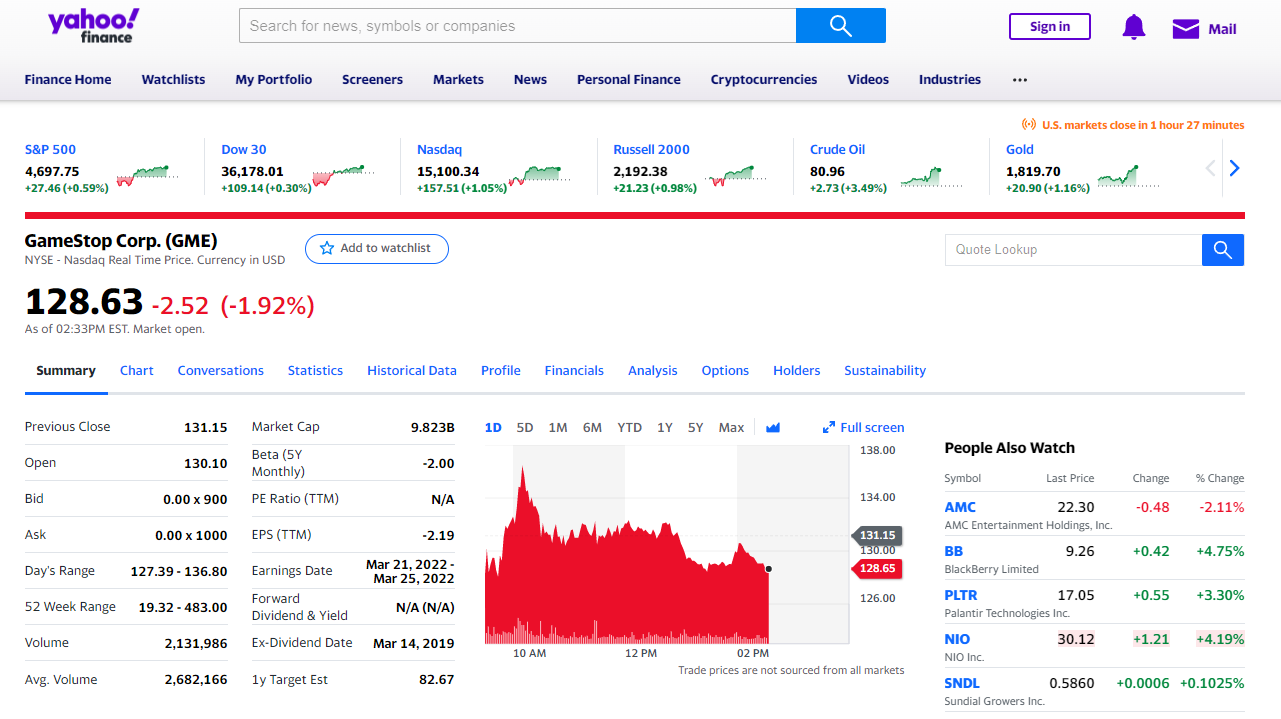
You knew it was coming, didn't you! Still, DYOR can begin with as simple a webpage as this one, because it gives you more than a lot of comments, videos and news articles do - information. Even so, the fun stuff is immediately visible. The sentiment painted by a multitude of financial media outlets is extremely negative.

Look at the phrasing of the two articles there. Both are incredibly negative, emphasizing the decrease (of gains!) in the first one and the second being not just misleading (they never said they want to sell you NFT's, I checked) but phrased the way most likely to turn you off to the news.
In fact, the most negative of these views comes from one particular 'analyst' whose piece was plastered across all of the 'major' publications. Going through this article, there's really no information to be found aside from the company's last earnings figure and the fact that he nicked his own prediction off another analyst!

Now, with so many of these financial media outlets raining fire down on a stock, one could imagine foul play - but that's not the point of this post. The point, rather, is that all of these publications seem to be painting a similar picture of doom and gloom for this particular ticker.
Thus, if you neglected to DYOR, you would be inclined to think that this is a very poor stock. Online sentiment is also very polarised, so rather than going down the rabbit hole, let's actually look at some very simple data.
Remember, our 'analyst' gave us a price target of $23 which is a lot lower than the current price and what it was when he published.
Actually DingYOR
The funky page above is actually the company's investor page, and if a company is public listed, it'll have a page like this where you can view all of their financial information. They're supposed to report it accurately every three months, and it's freely available - remember, data is always good to get from the source. I'd rather get my data from the SEC or the company itself than a news outlet or other website, who might distort it.
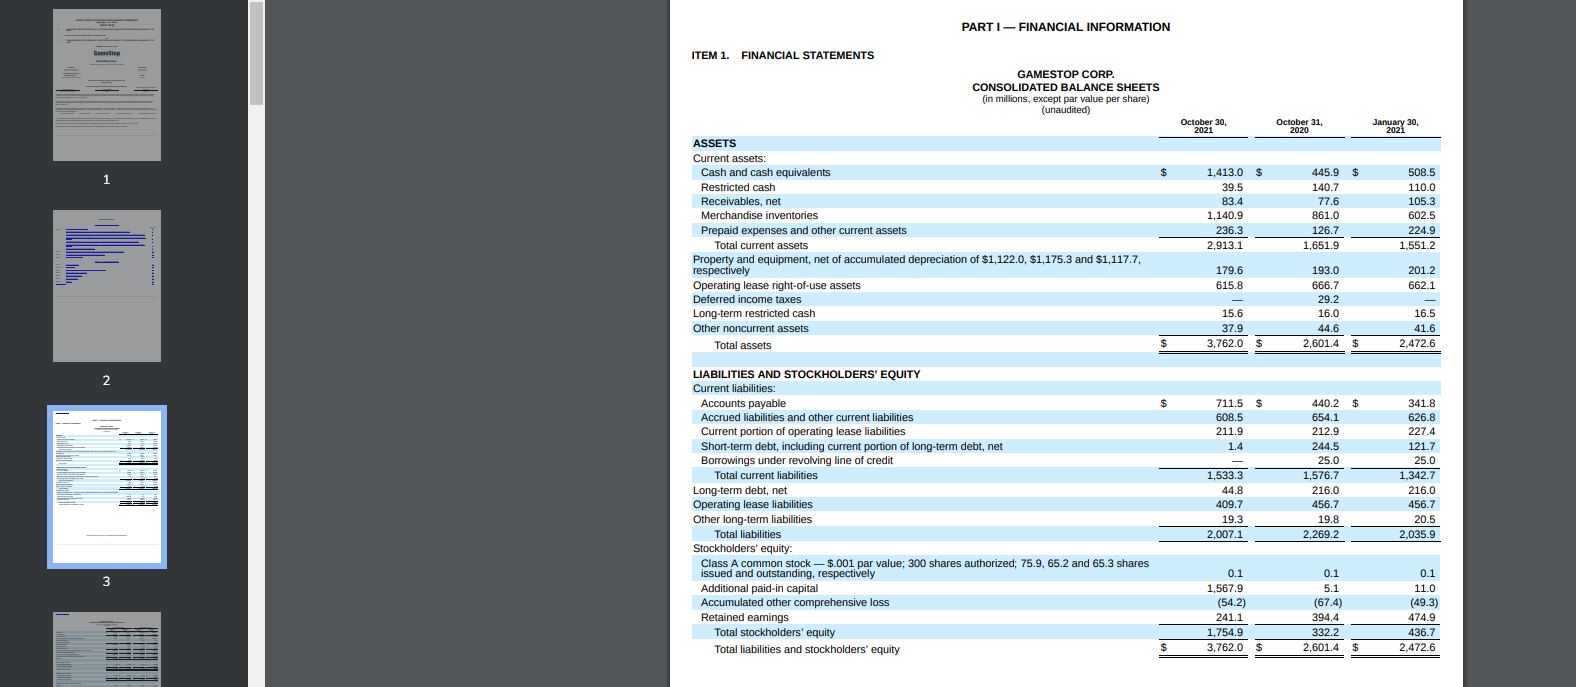
Wait, wait! I know, this is scary! It's an actual balance sheet! Don't worry though, we're only here to do basic DYOR, we're not going to try and distill all of these numbers. In fact, I'm only interested in this page, which is literally the first page of data past the cover page and the table of contents.
Actually, I'm only here to test our analyst friend's $23 price target. Remember, that article was blared all across every major financial news outlet, and if I'm not mistaken the idiot box as well on major business-focused channels that attract millions of people who DON'T do their own research.

In fact, the very first entry in this balance sheet is going to do all of the heavy lifting. Look: $1.4 billion in cash. This company has cold, hard green oozing out of its pores. When you buy a share, you get a share of ownership of the company and all of its stuff... and that means, you own a part of that treasure chest too. But how much?
Easy. We scan down the same page for the total number of shares the company has, which is 75.9 million. So, amount of cash divided by number of shares. That's $1.4b/75.9m, which equals...

Ruh-roh.
Aside, that's tool number 2 I needed to DMyOR. Browser, and now calculator.
As you see, based on the number of shares the company has in play and assuming that number hasn't been tampered with illegally (I may do another post on naked shorting or cellar boxing), that's $18.61 of cash you're getting for each share of the company you buy.
I don't need a calculator to work out what $23-$18 is. (It's less than $5)

Remember the author of that article posted on Nasdaq? This is his duckduckgo hit. Chief Analyst of some sort of financial media company. His price target, or the one he got behind, suggests that all of the company outside of cash is worth less than $5 per share or, again using that 75.9m total of shares, a total value of $379m.
Now, let's compare that $379m figure to some of the other assets in this balance sheet. For example, the value of property and equipment (land, buildings and equipment) the company owns at $179m or merchandise inventory (stuff they have in stock ready to sell, like games, PS5s, TV's, peripherals, collectibles, board games, and the litany of other stuff they have) at OVER $1.1 billion!
Even if they can't move ALL of that inventory, I dare you to walk into a store and say something like: 'Wall Street analysts said all this stuff is worthless, give it to me for free!'
Seriously, I want to hear back from you if you do!

I'm not going to spell anything else out, but a comparison of all of those assets to the share price target given by the analyst paints quite the picture. Even liabilities tell a healthy story given that the company has almost negligible long term debt.
If this company were a household, they'd have $1.4m cash in the bank compared to a $44k mortgage. Would you be happy with that? I definitely would.
What was the DYOR here?
A lot of people visited a finance site, scrolled down a bit, then right clicked on one of the articles there and put themselves through the experience of reading an 'analyst's view or the most convincing piece of clickbait.
They then allowed their opinion to be formed by all of the negative signals shoved down their throat across all of that, from the volume of articles to the phrasing and all of the other media tricks employed.
But you and I, we DidOurOR:
- We looked up the company's investor page, or went to the SEC page
- We opened up the latest filing, and scrolled down to the first page with data
- We loaded up our calculator app, or brought out the ol' faithful fingers and toes
- We read a handful of lines and noted those numbers
- We performed four or five operations on our calculator
And in those five easy steps, we were able to form our own opinion of the company's stock, filter out all of that noise, and even probably have a good laugh at the efforts of that analyst to plant cornflakes in our heads.
We then stopped laughing when we realized that most people don't DTheirOR and probably took that nonsense seriously.
Bonus LOLs
Do you want to know how our dear 'analyst' friends arrived at their magic $23 figure? Go back here for a sec:

Let's divide total shareholder equity down at the bottom ($1,754 mil) by total shares (75.9 mil).

Boom.
As you can see, these (likely grossly overpaid) analysts literally looked at this document and did about 10% of the research you did by reading this post. And, doing this and coming up with a share price target... the only assumption they made that even makes sense to me to reach this conclusion is if the company suddenly decided to cease operations.
They wish.
More Bonus LOLs
To really draw up some contrast, I took a look at Apple's 10Q reflecting June 2021 to make the same calculations. Here's the balance sheet:
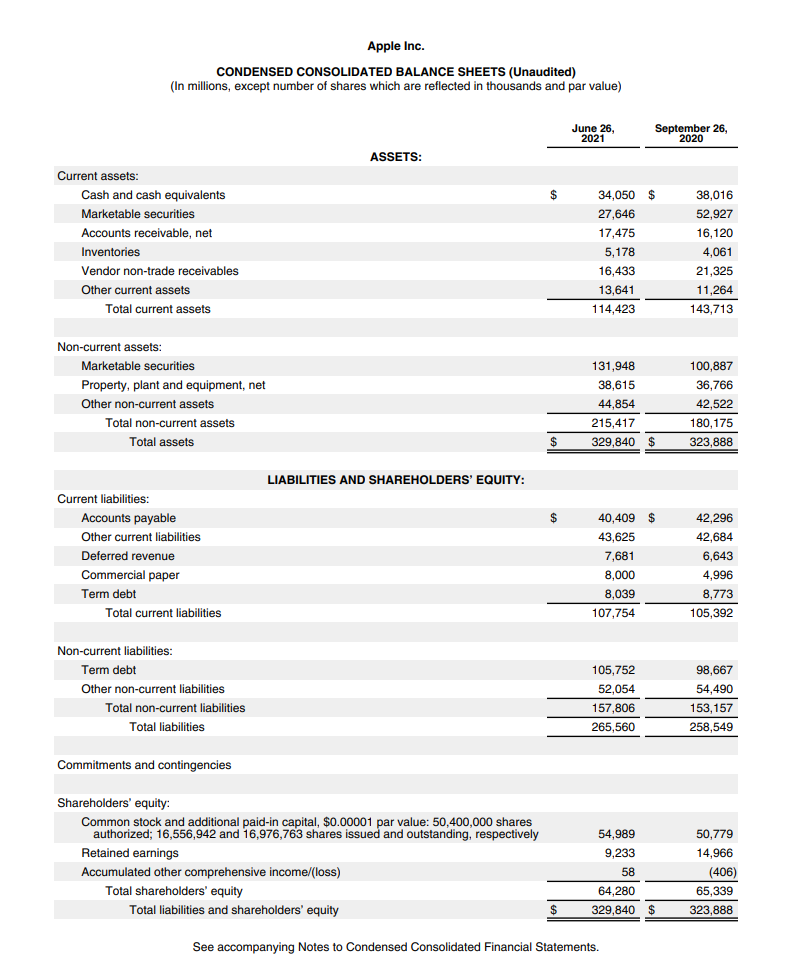
First, cash divided by total number of shares to see how much cash you get per share if you buy Apple stock.

So many digits. Still, that's interesting. Apple stock and our example ticker are both in the $1xx range currently, but you get 9x more cash with the other one. Okay.
Now let's do the math that our analysts did and see if we can come up with their price target for Apple. Shareholder's equity divided by number of shares outstanding...

Oof. There you have it. The tried and tested Wall Street Chief Analyst's price target for Apple stock: $3.78
DYOR is a good idea, huh?