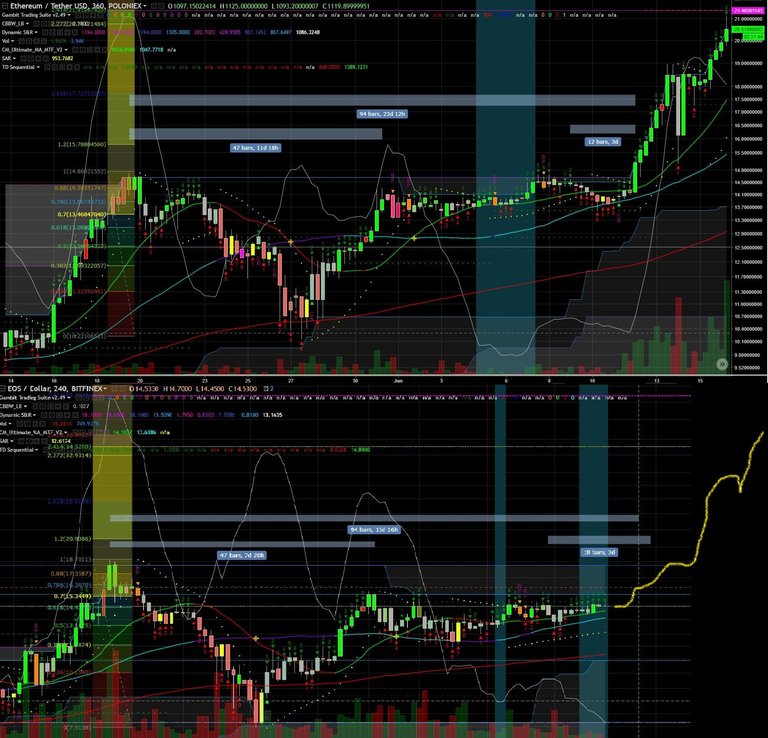
EOS, after making a recent local low of $8 on 1/18, has rebounded back up to $16 (0.70% Fibonacci retracement of its ATH) [all time high]) of $18.70. For the last week, it has been consolidating sideways and now BBs (Bollinger Bands) are squeezing (an indicator of low volatility...which generally precede higher volatility) on the 4 hour chart.
If we compare EOS (bottom half of image) to that of ETH [[ethereum] - top half of image)back in 6/2016 (6 hour chart), we see a similar chart fractal. Will EOS follow the ETH fractal? I'd give it a decent probability, assuming Bitcoin breaks above $11,700 and confirms a bullish rally.