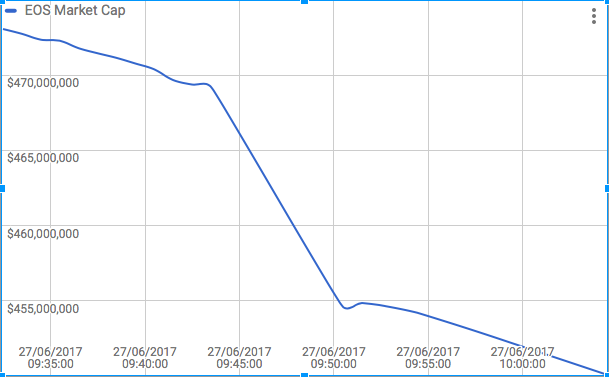
EOS Market Capitalisation Estimate Calculator
https://docs.google.com/spreadsheets/d/1688z4CC4A6FC2cRWVyLg3DiOwEHSNvm91PL0qCVEYqs/edit?usp=sharing

Enjoy and Take Care!
EOS Market Capitalisation Estimate Calculator
https://docs.google.com/spreadsheets/d/1688z4CC4A6FC2cRWVyLg3DiOwEHSNvm91PL0qCVEYqs/edit?usp=sharing

Enjoy and Take Care!
Great work, though until that 150,000 hit from yunabi it looked a lot like the price chart for ETH going down the tubes. :)
If anyone wants to see a breakdown of ETH per ICO period, I wrote a script for that last night.
Thanks! Do you have more information about and when 150,000 hit from yunabi? I though there was some bug in google script which did not update the value from JSON API. I hope it is fixed now! Thanks for your script, using it, it works perfectly!
I mentioned it in this post. I believe it's an exchange or group which is buying EOS on behalf of other investors. Dan's been talking about it quite a bit in the EOS Telegram.
Did they sent whole 150,000 in today window?
Yep. I took a screenshot of it here. You can view it yourself here.
I am seeing it! I though there was a bug in the script!
Hope there is a good affordable room for small investors!
keep in mind that the 150K is from over 10K small contributors.
They placed it today! In this transaction 150,000 ETH sent.
https://etherscan.io/tx/0x0045b60107a1930b59ae402a977d99ed7419b59a9990f1a935981c40117edc06
Excellent !!!
How much time it took you to add the JS and graph stuff?
Not so much time! I am already using similar functionality in my own custom crypto investment portfolio google spreadsheet! (But it took time to find out how to do it some time ago!)
Congratulations @nov3a4! You have completed some achievement on Steemit and have been rewarded with new badge(s) :
Click on any badge to view your own Board of Honnor on SteemitBoard.
For more information about SteemitBoard, click here
If you no longer want to receive notifications, reply to this comment with the word
STOPBy upvoting this notification, you can help all Steemit users. Learn how here!
Great work, thank you!
TY! YW! I just improved original EOS Market Capitalisation Calculator by @noaommerrr https://steemit.com/eos/@noaommerrr/eos-online-market-cap-calculator
Let me in the case you know about something what needs to be even further improved or added there. Thinking how to even further improve it.
good idea. I think most funding will happen towards end of each window. So it is not very efficient to estimate during first days. it will be valuable after first windows for sure. thanks
Yes, it could help to show market capitalisation evolution and estimate final market capitalisation depending on the previous contribution rate if the rate of the contribution would be in the same intensity as it was in previous period. And based on this to estimate possible EOS token value. Based on this, it could help to find out optimal EOS value window to invest in, hopefully. To see demand and capitalisation in time graphically.
Nice work man! Tyvm.