Analysis Summary:
Hi friends welcome to this TA update of Ethereum, I wanted to share some important interesting development that is looking to take place in the upcoming time.

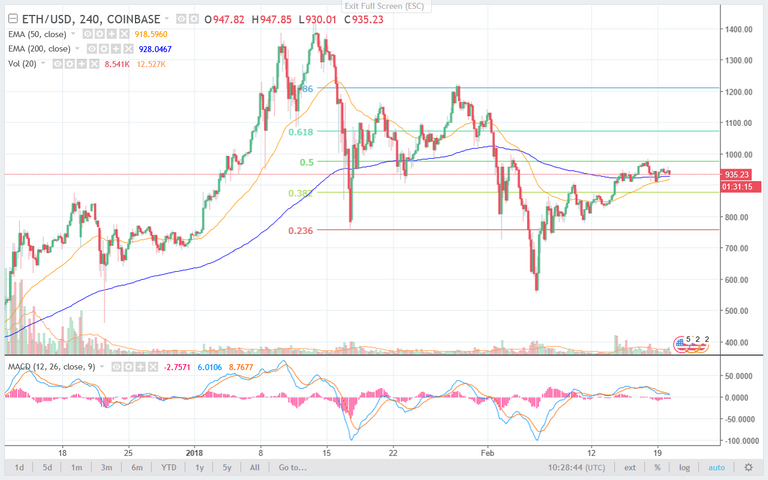
Looking at the 4 hour chart we can see that ETH has been trading sideways since some time after going through reversal from downward motion it was trapped into for a month or so.
But if you will look closely then you can see that EMA200 (blue) and EMA50 (orange) has converged below the Ethereum and providing strong support checking any steep fall so far, But ETH has been so far has been unable to utilize this support and move higher like the other crypto charts.
However you can see that this sideways trading has brought both EMA50 and EMA200 very close and in the upcoming days there is a possibility for a Bullish crossover between these both EMA is emerging and looking near which is going to happen after a 20 days waiting time.
This crossover can provide wings to ETH and make it. Further we can see that ETH was held by 50% retrace after moving above both the EMA50 AND 200 but I thing after the crossover this resistance will not be able to stop the ETH and the target at 61.8 and 78.6% respectively around $1100 and $1200 will be in play.
Looking at the MACD we can see that a bullish scenario is near and volume also looks supportive so far to support the buy side momentum. Based on this evidences we can say that a sharp upward rally is in development but like trading any pattern a breakout above 50% retrace should be waited for before fully going for the targets mentioned.
That will all for now, I will keep you people posted for any interesting developments in the chart.
Till then Good Bye and Best of luck to you Guys and Thanks for Reading my blog.

You got a 1.25% upvote from @upmewhale courtesy of @ajai!