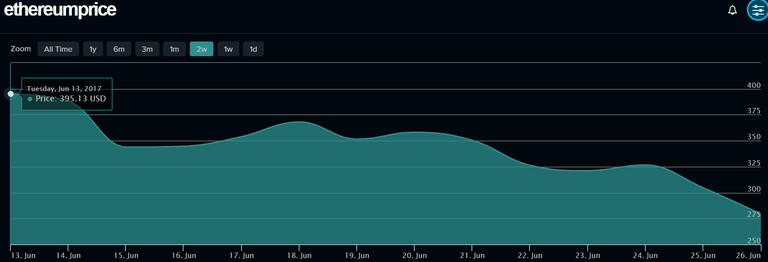
This is the latest Ethereum price chart for the last two weeks. Notice how it keeps dropping, has a weaker rebound, and drops again. The chart shows Ethereum at $275 but right now it's at $239.14 on Coinbase.
A lot of new money went into Ethereum in late May and early June. Like my money. Most investors get in when it's high and panic sell when it's low. I'm fortunate. I got completely out and still made $300 but I could've made $700 if I would have sold at $400 instead of $300. In mid-June I thought it was rebounding and would go back over $400 but it didn't.
I'll buy more Ethereum once it has a couple days in a row of price stability. Right now I think it's going to drop every day. I don't know where the new bottom will be. It might be as low as $100.
I am watching the 220, 190, and 135 levels. I would be surprised if it dips back to 100 on this pull back.