It seems that Ethereum investors are having a great time this month. However, when the cryptocurrency surges by so much, it is always a good idea to perform a thorough technical analysis and reevaluate options. That's why CoinSyncom joined forces with Ivan Andrejević once again to bring you the most thorough and comprehensive Ethereum (ETH) price analysis. Read on because the last time we cooperated, we predicted Bitcoin to come down from $10,000 to $3,600.
Ethereum (ETH) Price Analysis on a Weekly ETH/USD Chart
Ivan rightfully says that market cycles tend to repeat themselves. This is the main postulate of this part of the analysis. In Bitfinex ETH/USD weekly chart below, it is clearly visible that both times when Ethereum took its route through a falling wedge, it was followed by a rising channel. More often than not, rising channel formation ends in a bearish price break down.

Since December 2018, ETH is bouncing off the two strong barriers. The $100 support and $400 resistance levels, which is a great way to swing trade. However, in the midst of the ongoing crypto euphoria, it reached the resistance. Therefore, to predict the short-term movement, let's zoom in to see how the asset behaves in a shorter time frame.
Ethereum Analysis - Shorter Timeframes
Ethereum (ETH) price analysis would be worthless without a closer look at short term indicators. Therefore, we'll take a look at RSI and MACD to see if we can spot any divergences announcing the trend reversal.
The 1-hour Chart
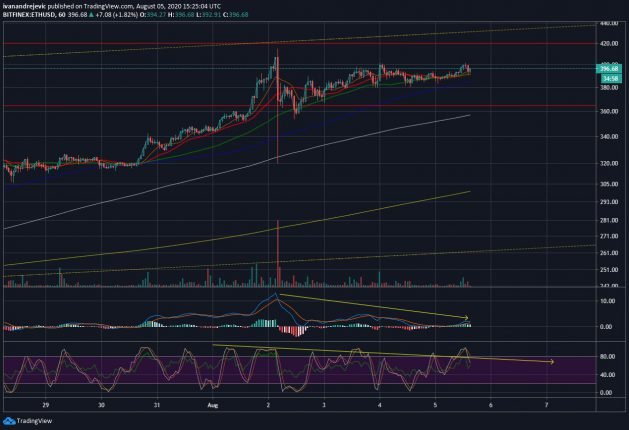
By taking a closer look at RSI and MACD, we can spot that the rally might be coming to an end. The RSI is slightly weakening while MACD doesn't show enough momentum to heighten the spike. These two are usually the most reliable trend reversal indicators and should be taken into account by those looking for short-term gains.
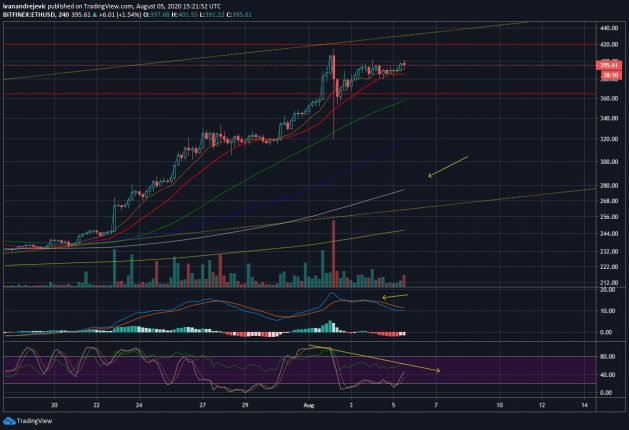
The 4-hour Chart
The 4-hour chart below is significant since it shows the 200 MA (the white oscillator line) still remains untested. Speaking purely technically, it should be tested and act as a support if the rally is to continue. Accordingly, on the 4-hour chart, RSI might signal a trend rejection if it doesn't manage to rise above 70 again. Additionally, if MACD fails to surpass the former high, it might signalize the weakening of the current trend.
The Daily Chart
To see the price movement throughout the whole rising channel, we are going to take a look at the daily ETH/USD chart (below). If the $400 level proves to be too strong for Ethereum to breach, there is a high possibility for it to start spiraling down towards some of the previous support levels.
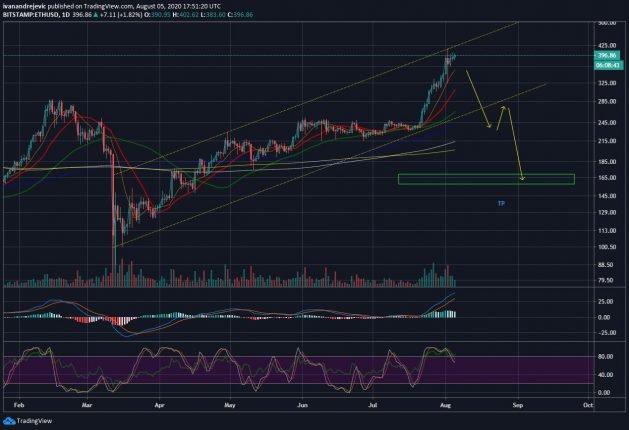
Interestingly, while 200 MA on a daily chart provided enough support for Ethereum, it is possible that it will come down to re-test it. If it does, the price will approximately coincide with the $215 support. The level that held ETH above the water since early June. However, once there, ETH will be lower than the rising resistance of the ascending channel. In simpler terms, it might be foreshadowing possible hard times for investors.
If such events transpire, the first major target price would be approximately between $150 and $160.

More Technical Indicators
During the last 4 hours, RSI, Stochastics, Commodity Channel Index, and Williams %R are all in the neutral area. This might signalize the beginning of a trend reversal or a period of accumulation.
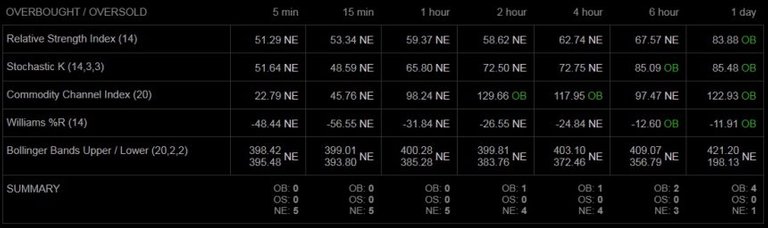
Source: Coinalyze.net
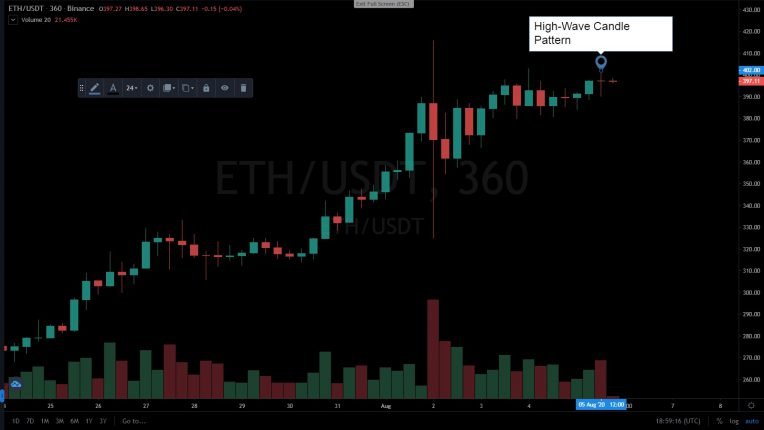
Furthermore, there are some notable candlestick patterns that we have to acknowledge in the Ethereum (ETH) price analysis. Both in 4-hour and 6-hour charts the last closed candlestick formed a high-wave candle. If some of you are not familiar with the formation, this kind of candlestick signifies rapid fluctuations. More often than not, this kind of price movement implies a serious threat to the current price movement.

Ethereum (ETH) Price Analysis Should Count in the FOMO
Signals we encountered in this Ethereum (ETH) price analysis (and the declining volume) are mostly negative. Nevertheless, traders should not forget about the FOMO effect. If the investing forces behind Ethereum manage to rally once again and neutralize the rising channel, the whole analysis becomes invalid.
Therefore, Mr. Andrejević prepared one special weekly chart analysis for that scenario. It shows that, in the case of bulls' victory over bears, Ethereum would have a huge double bottom formation. Consequentially, marking the beginning of a new gigantic bull run that might take ETH way up above $1,000. So, set up those stop losses.

Disclaimer:
You should look elsewhere for investment advice since this isn’t it. Even if it looks like it, it’s not. Cryptocurrencies are extremely volatile and risky speculations. Always do your own research. Consider consulting an investment professional prior to investing your money.
Please, in the comments section below, let us know where do you see Ethereum in the coming weeks. We are excited to hear your opinion.
 When you start feeling the irresistable urge to share our content and click on one of the sharing icons below, you'll be rewarded with Sharpay (S) Tokens.
Now, ain't that cool or what? Getting paid for sharing!!
Of course, to receive your tokens, you'll need a Sharpay crypto wallet. Therefore, first you need to register on Sharpay's OFFICIAL WEBSITE and the wallet is there.
When you start feeling the irresistable urge to share our content and click on one of the sharing icons below, you'll be rewarded with Sharpay (S) Tokens.
Now, ain't that cool or what? Getting paid for sharing!!
Of course, to receive your tokens, you'll need a Sharpay crypto wallet. Therefore, first you need to register on Sharpay's OFFICIAL WEBSITE and the wallet is there.
Thanks for sharing!
😉
Originally published on CoinSyncom: https://coinsyn.com/ethereum-eth-price-analysis-the-crucial-moment/