The above link/graph has a lot of information on it, let's break down the relevant pieces.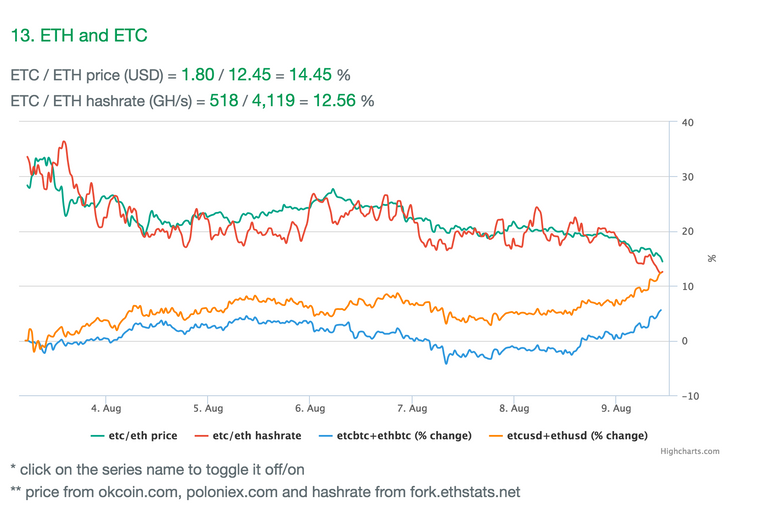 http://slacknation.github.io/medium/13/13.html
- The green line represents Ethereum Classic (ETC) price divided by price of Ethereum (ETH).
- The red line represents ETC hash rate (number of calculations done by computers on the network per second) divided by ETH hash rate.
- The orange line represents the % change in value of ETC+ETH together, with respect to the US dollar.
ETC/ETH price and ETC/ETH hash rate correlate long term but oscillate short term
The green and red lines trend together. At its peak, an ETC coin was worth roughly 45% of an ETH coin, but this was mostly due to hype and bandwagon jumpers. At that time, the ETC/ETH hash rate was 35%, so the price was untenable and quickly dropped once investors realized the price was over inflated.
The price and hash rate graphs are slightly offset, sort of similar to how a sine curve and cosine curve reach peaks and valleys at differences of pi/2 but oscillate together because miners and investors are working based on economics and opportunity cost. Miners see the price of ETC rise compared to the hash rate and decide to mine the more profitable chain, while investors see the hash rate low, consider the price position untenable and sell. Then the graphs reverse and the opposite happens: miners see the price of ETC fall and decide to mine the ETH chain which is now more profitable for them, and investors see the hash rate high and buy.
As of this moment, the hash rate ratio is 12.56% while the price ratio is 14.45%, meaning we can expect the hash rate ratio to rise and the price ratio to fall. While short term the graphs are slightly reverse-correlated, in the long term, the hash rate ratio and price ratio graphs tend to move in the same manner and are highly correlated.
ETH is winning the battle of the chains
Now, if you notice, the overall trend of the graph over the past week is downwards. This is mostly due to two things:
- ETC is NOT a traditional pump and dump like other altcoins in the past (create an altcoin, buy and mine it, hype the shit out of it, price inflates, sell it off, interest in the coin dies off and the coin disappears), but it's price rose rapidly mostly due to hype, and after a few days when hype dies down, the price drops as well
- The Ethereum Foundation, Vitalik Buterin, Vlad Zamfir, and many important developers in the industry have publicly sided with ETH and stated they would be working solely on that chain.
Here are the ETH/USD and ETC/USD graphs over the past 14 days:
ETH/USD:
ETC/USD:
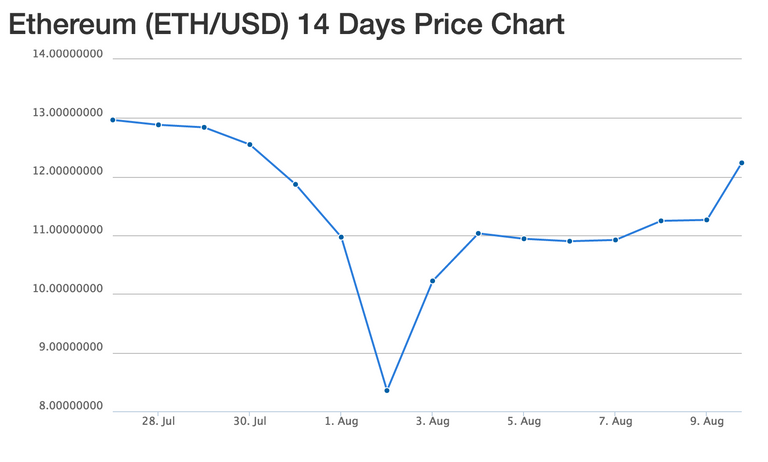
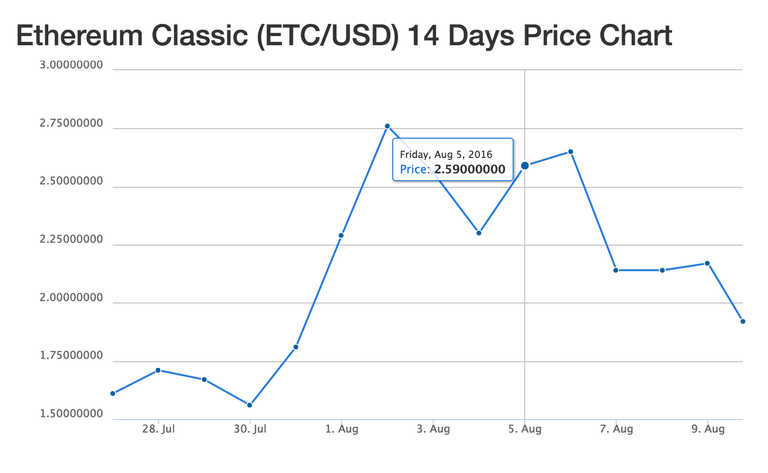
As the price of ETC rose, the price of ETH lowered, but now the reverse is happening. ETH is on the rise while ETC falls.
One Chain to Rule Them All
Having one dominant chain is better for the overall price than two split chains.
Let's look at the ETC/ETH hash rate and price graphs from the last few weeks again:
July 31-August 6:
August 4-August 10:

The lowest dip in the orange line (ETC+ETH % change with respect to US dollar) occurs at exactly the same time as the ETC/ETH price reaches it's maximum. As ETC/ETH price falls, the orange line rises. If ETC continues to fade away, the price of ETH will continue to rise faster than ETC's drop.
As @crypt0 pointed out in a recent blog post (https://steemit.com/ethereum/@crypt0/ethereum-news-price-about-to-take-off-seems-likely), Devcon2 is coming. With so many developers on ETH's side and Vitalik presenting his visions and breakthroughs during a 2-3 day Microsoft sponsored Ethereum summit, the price may continue to rise past the point of the original hack.
After the fork the price steadied around 14.3. Seems to be back to that level now, but as you said only when the value of ETC is lower.
Gunna be Oight!