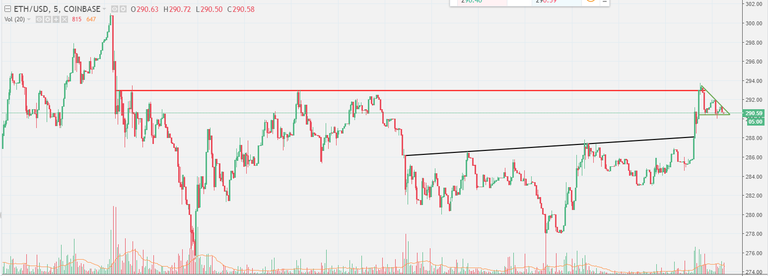
As we can see in the chart above, an inverse head and shoulders pattern has formed, followed by a bullish breakout with upward momentum.
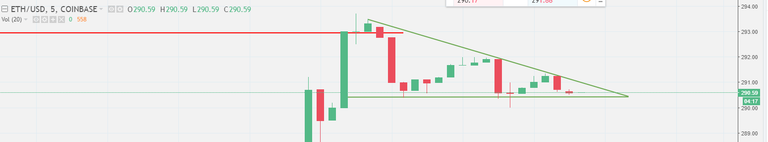
A descending triangle has formed as well, signaling a further breakout to the up or downside is approaching.
If we can break the current resistance around the $292-293 range, we could see ETH rise quickly near or at the $300 range.
Let me know what your thoughts are in the comments below, cheers!
Please Upvote, Follow, and Resteem!