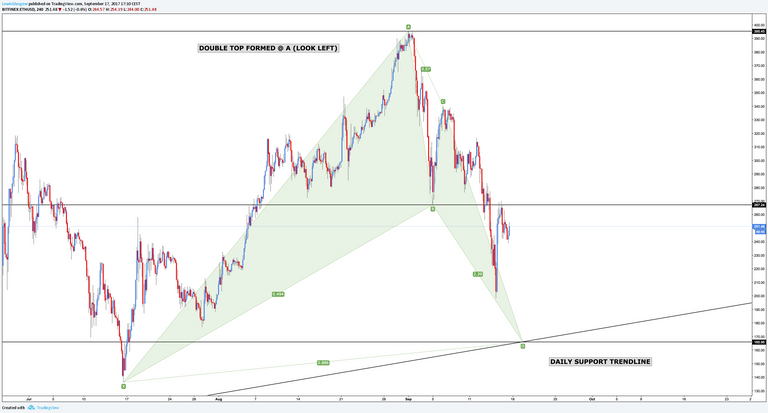
Hello traders, today we have ETH/USD on the 4h chart with a potential bullish bat pattern, it's currently completing the C to D leg and closing in on the PRZ (Potential Reversal Zone).

This is very similar to my previous analysis with Bitcoin, you can find this here.
The measurements for a valid bat pattern are detailed below.
B: 0.382 - 0.50
C: 0.382 - 0.886
D: 1.618 - 2.618
Final X to D: 0.886
The D point aligns with the daily support trendline which provides an excellent area to buy low around $165.

More crypto analysis on the way :)
I'll be looking for additional confirmation before taking the trade.
Click here to view my original post on TradingView.
Don't forget to upvote, resteem and follow me for in-depth market analysis and investing education.
As long as there is no more BTC FUD the charts will play out. However, there is more BTC FUD coming.
Yeah there will be more panic selling closer to the 30th in my opinion.
Because of Metropolis or China FUD regarding mining pools?
This post recieved an upvote from minnowpond. If you would like to recieve upvotes from minnowpond on all your posts, simply FOLLOW @minnowpond
This post recieved an upvote from minnowpond. If you would like to recieve upvotes from minnowpond on all your posts, simply FOLLOW @minnowpond
This post has received a 8.30 % upvote from @bellyrub thanks to: @lewisglasgow.
@lewisglasgow got you a $3.0 @minnowbooster upgoat, nice! (Image: pixabay.com)
Want a boost? Click here to read more!