I personally shortlisted a handful of altcoins, which I plan to invest in. Today I present to some key observation on one such chart. The way I approach is I analyse the charts on the weekend to enable me to take a speculative stake in the following week. The following information should act only as a reference and in no means an investment advise, since I am unaware of the readers financial situation and risk appetite. The analysis methodology is based around recognition of Patterns (Trend lines, Triangular, Horizontal etc), Fibonnaci, Wkycoff analysis and market layout
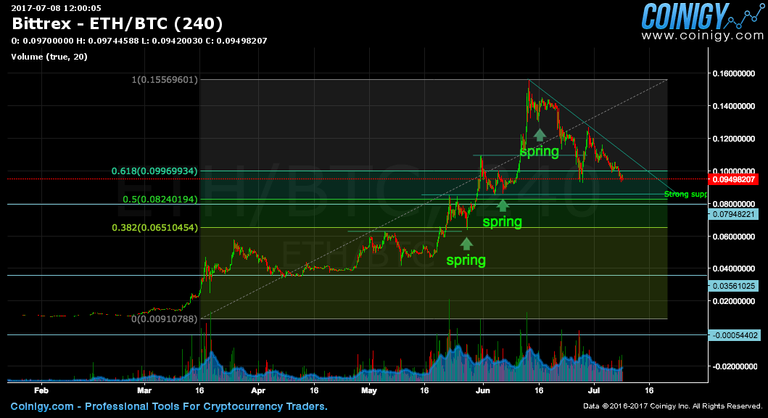
Price has clearly broken the 61.8% fib level, and now lingering around the last low of 0.09498 level. In order to completely confirm the weakness, I would expect retest of 61.8% and then bounce & fall towards the 50% fib level (0.0800) level.
So overall, at this moment ETH appears weak and 50% fib level (0.082 to 0.08 price level) provides a strong support point and buy signal. There is also evidence of a triangular pattern formation in the background.
Have a nice weekend!!
Congratulations @rajeshrajan! You received a personal award!
You can view your badges on your Steem Board and compare to others on the Steem Ranking
Do not miss the last post from @steemitboard:
Vote for @Steemitboard as a witness to get one more award and increased upvotes!