Stock Market Reflection
On 31st Jan 2025:
Natgate was oversold, 1.72, I was thinking to purchase the stock at a lower price without realising the fact that it is actually undervalue. Despite 2 days of sideway trading, I still stick with my plan.
Lesson learnt: Should purchase once it is undervalue, getting a small exposure will be nice enough
Hst: It is a bit dangerous to sell of a quarter of the stock given that the long run of share is going to be optimistic.
No Lesson learnt and no solution
Ytl Power: It is so fortunate that I able to secure a low price of the stock at 2.955. No idea when to sell off (Should plan one) given the fact that the demand for computing power won't lower just like the demand for electricity.
Takaful since 25th Nov to 25th Jan, It was a mistake for not profit taking at its highest pricing level, at 4.12? Even though I missed out the highest price, yet I missed out the second ideal timing, at 3.90. This is a sideway stock which have to do profit taking in appropriate timing.
---
Below is a 50-year projection table estimating the Chinese population proportion in Malaysia, assuming a current TFR of 0.8 and an annual decline rate of 1.5%. This model simplifies complex demographic dynamics but provides a baseline for understanding trends.
Assumptions
- Starting Proportion (2023): 22% (current estimated Chinese population in Malaysia).
- Annual Decline Rate: 1.5% (due to sustained low fertility and aging population).
- No Net Migration: Ignores immigration/emigration effects.
- Constant TFR: Assumes no future policy changes or societal shifts affecting fertility.
Projection Table (2023–2073)
| Year | Chinese Proportion (%) | Notes |
|---|---|---|
| 2023 | 22.00% | Baseline (current estimate) |
| 2024 | 21.67% | |
| 2025 | 21.34% | |
| 2026 | 21.02% | |
| 2027 | 20.71% | |
| 2028 | 20.40% | |
| 2029 | 20.09% | |
| 2030 | 19.79% | |
| 2031 | 19.49% | |
| 2032 | 19.20% | |
| 2033 | 18.91% | |
| 2034 | 18.63% | |
| 2035 | 18.35% | |
| 2036 | 18.07% | |
| 2037 | 17.80% | |
| 2038 | 17.53% | |
| 2039 | 17.27% | |
| 2040 | 17.01% | |
| 2041 | 16.75% | |
| 2042 | 16.50% | |
| 2043 | 16.25% | |
| 2044 | 16.00% | |
| 2045 | 15.76% | |
| 2046 | 15.53% | |
| 2047 | 15.29% | |
| 2048 | 15.06% | |
| 2049 | 14.83% | |
| 2050 | 14.61% | |
| 2051 | 14.39% | |
| 2052 | 14.17% | |
| 2053 | 13.96% | |
| 2054 | 13.75% | |
| 2055 | 13.54% | |
| 2056 | 13.33% | |
| 2057 | 13.13% | |
| 2058 | 12.93% | |
| 2059 | 12.74% | |
| 2060 | 12.55% | |
| 2061 | 12.36% | |
| 2062 | 12.17% | |
| 2063 | 11.99% | |
| 2064 | 11.81% | |
| 2065 | 11.63% | |
| 2066 | 11.46% | |
| 2067 | 11.28% | |
| 2068 | 11.11% | |
| 2069 | 10.95% | |
| 2070 | 10.78% | |
| 2071 | 10.62% | |
| 2072 | 10.46% | |
| 2073 | 10.30% |
Key Observations
- By 2073, the Chinese population would fall to ~10.3% of Malaysia’s total population.
- The decline accelerates over time due to compounding effects of low fertility and aging demographics.
- Thresholds:
- Below 15%: ~2045.
- Below 10%: Beyond 2073 (extending to ~2123 for <5%).
Caveats
- Migration: Increased emigration (e.g., brain drain) or immigration (e.g., policy incentives) could alter the trajectory.
- Policy Changes: Pronatalist policies (e.g., subsidies for large families) could slow the decline.
- Cultural Shifts: Changes in marriage rates or family norms might affect fertility.
Let me know if you’d like adjustments to the model (e.g., varying decline rates or migration scenarios).
-
-
-
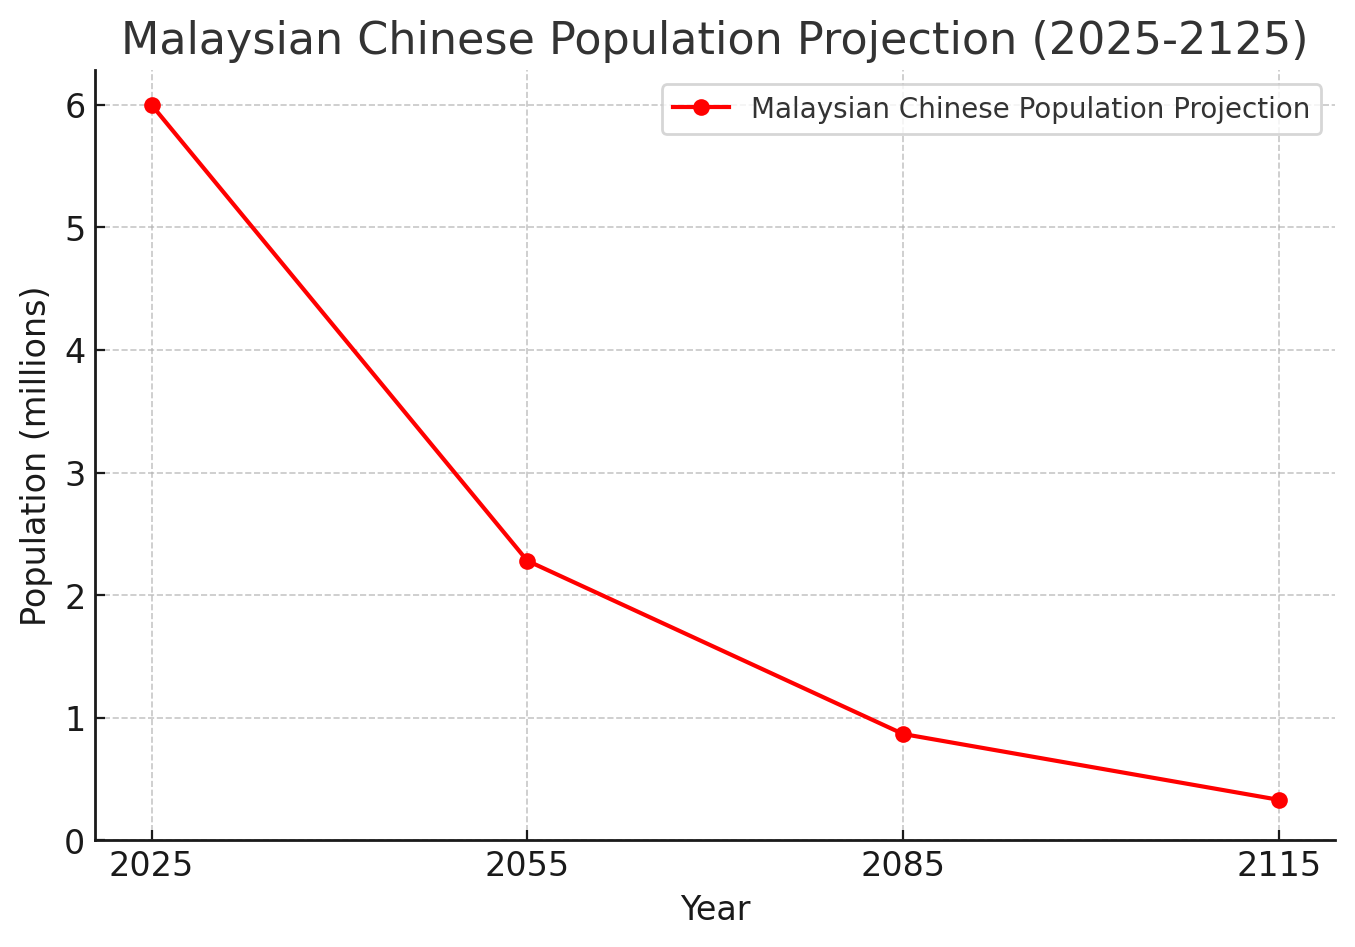
To estimate the Malaysian Chinese population 100 years from now (in 2125), assuming no changes in fertility rates, immigration, or policy interventions, we can apply a generation-based decline model, similar to the South Korean projection.
Key Assumptions:
- Current Malaysian Chinese population: ~6.5 million (as of 2020)
- Total fertility rate (TFR): ~0.79 (below replacement level of 2.1)
- No immigration/emigration effects
- Each generation (~30 years) retains ~38% of the previous population (since 0.79/2 ≈ 0.395, meaning each couple has 0.79 children, leading to ~38% retention per generation).
Step-by-Step Projection
- 2025: ~6.0 million (estimated decline from 2020)
- 2055 (~1 generation later): 6.0M × 0.38 ≈ 2.28 million
- 2085 (~2 generations later): 2.28M × 0.38 ≈ 0.87 million
- 2115 (~3 generations later): 0.87M × 0.38 ≈ 0.33 million
- 2125 (extrapolated): Likely ~300,000 or fewer
Conclusion
By 2125, under the assumption of no change in TFR and no immigration, the Malaysian Chinese population could decline to below 300,000, representing a 95% reduction from today. This trajectory suggests a near demographic collapse, with severe consequences for community sustainability and representation.