If there is one piece of advice, I could give to DAX users, it would be to keep the structure of the model simple. That includes flattening or converting from a snowflake to a star.
Take a look at this. Its an image of a model I found online some time ago.
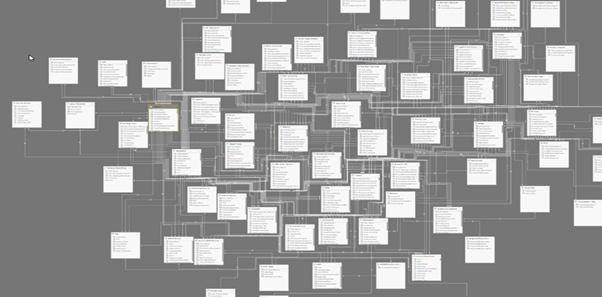
How does it make you feel? It gives me panic attacks just looking at that data model. Imagine how complex the DAX calculations are in that model. And imagine how easy it would be to make a mistake. When you’re working with DAX and simple models, it’s easy to get a value you are not expecting. But working with a model like that, well for me, that’s a living hell. I would find it hard to trust any value, even by the best DAX coder in the world.
Star Schema
Now take a look at this
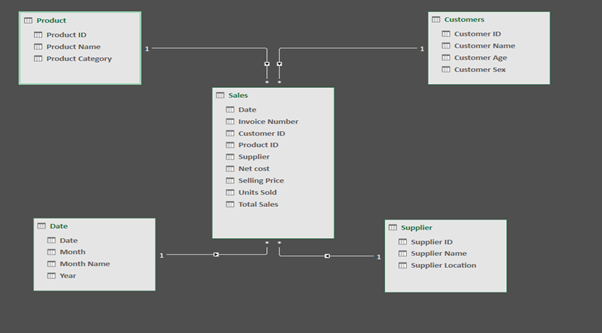
I feel like I can breathe again. This is a perfect little star schema. Ideal for analysis in Power BI. Ok so this example is really simple but when you are working with DAX, models like this mean you don’t have to spend long working out relationships and flows. It’s easy to understand and DAX calculations can be kept simple.
In the middle of this star we have a facts table. If we look closely you will see stars on this table where they are joined by relationships. This makes it easy to identify a star table in PowerBI or Power Pivot. The table in the center of the star should always be your facts table
The tables surrounding the center/facts table are the dimension tables. We use these tables to slice, dice and filter the facts tables. The dimensions tables contain the one side of the One to Many relationships. In Power BI and Power Pivot it’s easy to identify the one side, as it has this little 1 where the relationships join. Filters flow from the dimension tables to the facts table. They do not tend to flow from the facts table to the dimensions tables.
Snowflake
We will take a look at a Snowflake now.
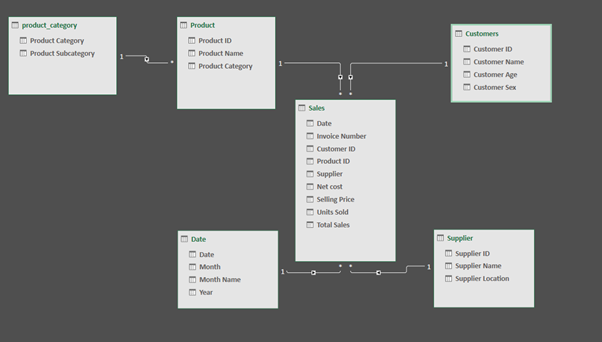
Its looks rather simple and a bit like our star schema. But in this case, one of our dimension tables has a leaf. Our products table is connected to another table, products category.
When the branches of a star schema have further branches, this is known as a snowflake. Our example is extremely simple with only 1 branch but imagine a model with many more branches. Working with data models like this requires more detailed knowledge of DAX and there is more to remember about the model. More tables and duplicate values such as the product category showing in two tables also reduces the performance and size of your model.
Very often when you have a snowflake you can flatten it down to a star and that’s what we are going to look at in the rest of this article.
The Problem – Lets Convert this Snowflake to a Star
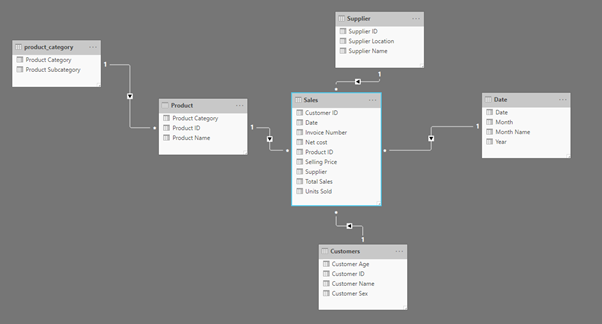
Our data model is made up of a Sales Facts table. Our dimensions tables are Products, Suppliers, Customers, Date and Products subcategory.
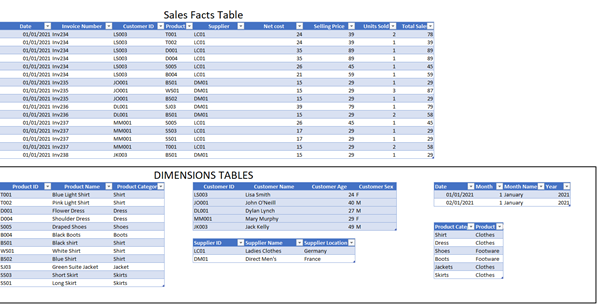
Once we load it this way into our model, we can obtain the following structure
Solving this Problem with DAX
Although not the ideal situation, you can still work with a snowflake in DAX and many people do with ease. Especially if you only have one facts table. But you don’t always only have one facts table. And it is important to stress if you can reduce the number of tables, branching and duplicate values you will have a more optimal model.
So how could we flatten this model with DAX? Looking at our Products and Products subcategories tables, there is only one column in the subcategories that is not in the Products. And that is the actual subcategory.
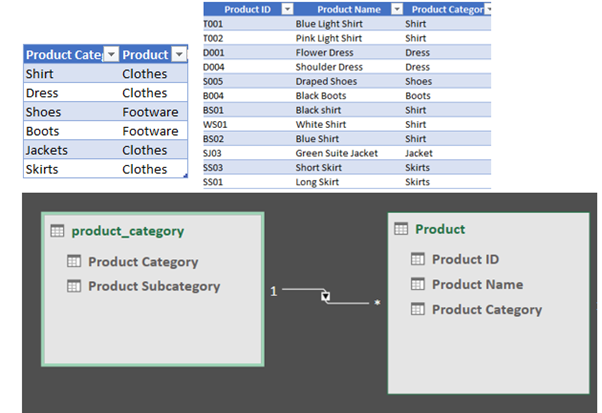
We could easily pull the subcategory column into the Products table by means of a calculated column.
We would create the calculate column in the Products table and the function used would be
= RELATED(product_category[Product Subcategory])
The RELATED function works by reaching into a table joined by relationships or chain of relationships and it returns a single column.
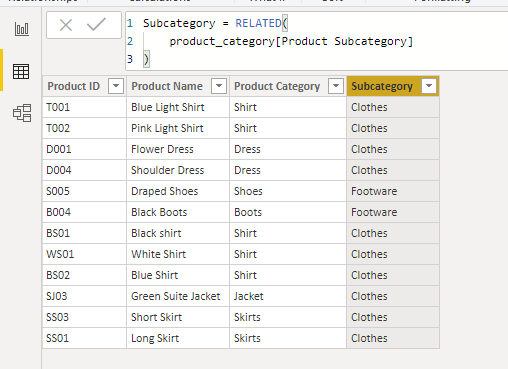
Once we have added this new column to the Products table we can then go ahead and hide the products subcategory table from our report view. This will stop users trying to use this table for filters or grouping.
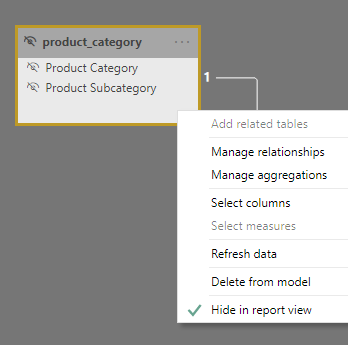
The problem with this is that we have a calculated column, taking up space in your model and recalculating any time the model is refreshed. The table we have hidden is still there and is still loaded into your model and also refreshed.
Solving this Problem with Power Query
To create a more optimal model, we would change the tables before they are loaded into our model. This is easily achieved in Power Query. The steps are as follows
From the Power BI home ribbon select Edit Queries. This will open our query editor.
Select the query for the Product table
From the Home Ribbon, select Merge queries.
The merge dialogue box will open and the Product table will be selected. Select Product_category for the second table and then select the matching fields. In this case the matching field is the Product Category column
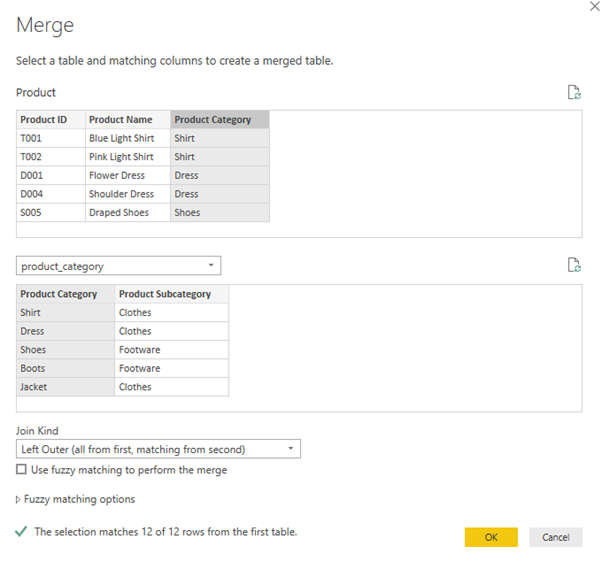
We will leave the join kind as the Left Outer.
At the bottom of the Merge dialogue box we can see some text saying The selection matches 12 or 12 rows from the first table. Next, select OK.
The result of this is a new column in our Product table. However, the cells in this column contain a table and we need to extract the data from the table. This table is the related rows from the Products subcategory table.
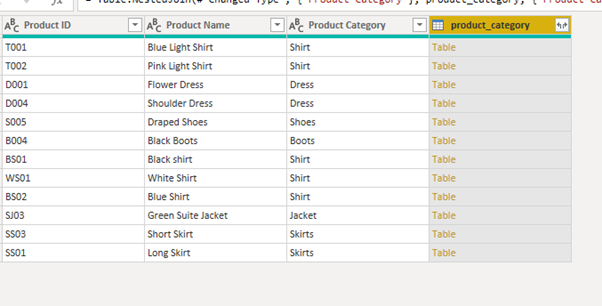
By clicking on the cross hair on the top right of the column name we are given the options to extract the table information.
We do not need the Product Category column as this is already included in the Products table. All we need is the Product Subcategory
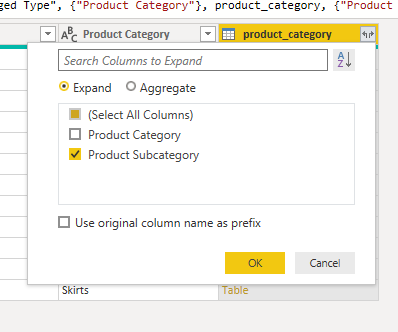
Once we select ok, the column in the Products table will be expanded to show the product subcategory.
Disable Load of unneeded table
The final step is to select the Product_category query and disable the option to Include in report refresh.
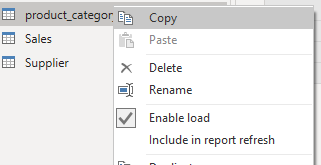
Now if we close and load to our model, our products table will include the column for subcategory and we have one less table loaded to our model.
Take A FREE course with us Today!

- includes XLOOKUP and will soon include Dynamic Arrays

Power Query Excel 365

Best Value Excel and Excel Power Tool Learning. Access All Areas, Unlimited Learning Subscription

SIGN UP

- includes XLOOKUP and will soon include Dynamic Arrays

Power Query Excel 365


SIGN UP
SIGN UP
Cross posted from my blog with SteemPress : https://theexcelclub.com/easy-steps-to-convert-snowflake-to-a-star-dax-modeling/

Upvoted by GITPLAIT!
We have a curation trial on Hive.vote. you can earn a passive income by delegating to @gitplait
We share 80 % of the curation rewards with the delegators.
To delegate, use the links or adjust 10HIVE, 20HIVE, 50HIVE, 100HIVE, 200HIVE, 500HIVE, 1,000HIVE, 10,000HIVE, 100,000HIVE
Join the Community and chat with us on Discord let’s solve problems & build together.
Congratulations @theexcelclub! You have completed the following achievement on the Hive blockchain and have been rewarded with new badge(s) :
You can view your badges on your board And compare to others on the Ranking
If you no longer want to receive notifications, reply to this comment with the word
STOPDo not miss the last post from @hivebuzz: