Learn how to fix totals and subtotals in DAX for PowerBI and Power Pivot
The problem of incorrect totals and subtotals in DAX is a common problem for both Power BI and Power Pivot users. But these incorrect totals, are not wrong. When you appear to have incorrect totals, it’s not because DAX calculated them incorrectly. DAX just does what you tell it to do.
Therefore, obtaining correct or incorrect totals is down to understanding how your DAX calculation is working. Once you have figured out how things are calculating, you can then decide how to treat the totals.
In this article we are going to look at the reasons why totals and subtotals are not what you are expecting, then we will look at solutions for solving this problem and making sure the totals you show are calculating what you are expecting.
Hopefully, after this, you will no longer have incorrect or wrong totals in your DAX calculations anymore!!!
Contents - Totals and Subtotals in DAX
Check your totals – how to fix incorrect totals in DAX for Power BI and Power Pivot
Understanding Filter Context in Dax – Example 1
Filter Context and the Total Row
Understanding Filter Context in Dax – Example 2Step 1 – Create a logical test to see if a row is a total or subtotal
Step 2: Use Logical test in an IF statement to apply values to non-total rows.
Step 3 – Apply the IF statement to our original calculation.
Step 4 - Testing removed table totals.
Correcting Totals and Subtotals in DAX for PowerBI and Power Pivot.SUMMARIZE to correct totals in DAX.
The Filter Context
To understand how DAX is calculating values, totals, and subtotals, you need to understand the filter context. You can apply filters in many ways.
Both rows and columns on a pivot table or chart provide filters. In the image below, the Year and the Product Category have been added to a pivot table as filters. These filters are calculated using the AND statement. For example, the value of Dolls in 2018 contains a filter that in English says Filter for 2018 AND also filter for Dolls.
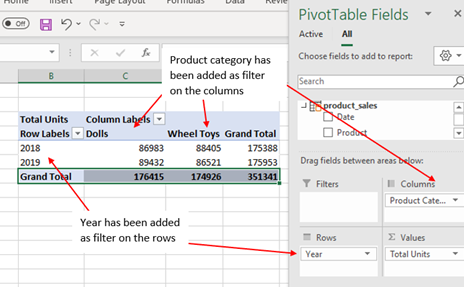
Any filter, slicers, and timelines that you included on a pivot table or chart also provide filter context. Again, these filters are based on using the AND statement.
For the remainder of this article, We will work through some examples of filter context and how they can create incorrect totals or really, totals you are not expecting. And then we will look at how we can resolve these problems.
Our model is very simple. We have 3 tables. Product_sales being the facts table and products and data being our dimensions tables.
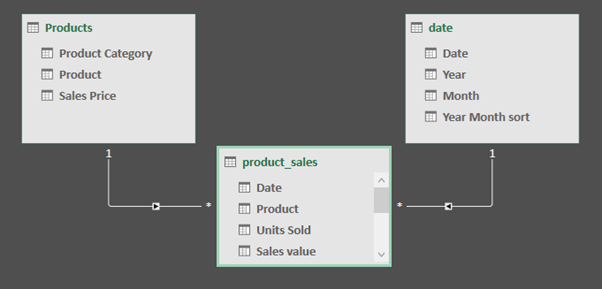
Understanding Filter Context in Dax – Example 1
Our Product_sales Table contains a column for the number of units sold. We want to see how many orders are for units of 100 or more. In our product sales table, we have created the following two measures.
Total Units:=sum(product_sales[Units Sold])
Large Orders =IF([Total Units]>=100,1)
Using Product as a filter on the row we can place these two measures into a table.
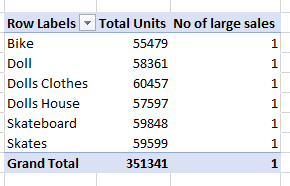
The first measure, Total Units looks fine. However, DAX is calculating each product to have only 1 large sale and the total is showing as 1. If each product has 1 large sale and there are 6 products, then should the total not be 6? And that’s assuming each product does have only 1 large sale. I know from the data; this is not the case.
Before we move on to correcting the total, and other values in this report, let's work out what is going on by way of filters.
When we create the measure, =IF([Total Units]>=100,1) we create this without any filter. There are no external filters (rows, columns, slicers) until we add the measure to a chart or table.
Therefore, before we use filters on this measure, the measure takes the value from our total units measure and checks to see if it is greater than 100 and if it is greater than 100, it returns 1.
When we add this measure to our table, which contains products as the filter, DAX filters the table by each Product. The first row is filtered to just bikes. DAX then filters the table to just bikes and then calculates the sum of the units sold on only that filter section. In this case, the value is 55,479. The IF statement then asks if this value is greater or equal to 100. As this value is greater than 100, 1 is returned as the number of large sales for bikes.
DAX then moves to the second row on the table, which has a filter for Doll. The same calculation is carried out for that row of the table. DAX will sum the total units sold, giving 58361, and then it checks to see if this value is greater or equal to 100 and returns 1 because this value is greater than 100. The same calculation is applied for each row of the table. This is filter context in action.
Filter Context and the Total Row
When we get to the total row, there is no filter on product. So, DAX takes the total units sold, 351341 and checks to see if this is greater or equal to 100 and as it is, DAX also returns 1 for the totals.
This is a very simple example of how filter context works, and as you can see, it can have a big impact on the values shown and you do not always get the results you expect.
Solution
To fix this problem we can use the SUMX function.
=sumx(product_sales,if([Total Units]>=100,1))
This function says, iterate over each row of the product sales table, and check to see if the units sold is >=100. Where the units sold are >=100, give it the value of 1. Then when the iteration over the table is complete, take all of these 1’s and sum them together.
Using this measure in our table will return the correct values for us.
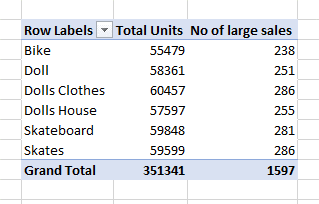
As mentioned, this is a very simple example to explain how the filter context works. Adding SUMX or another iterator is not always the answer.
Understanding Filter Context in Dax – Example 2
Take a look at this simple pivot table.
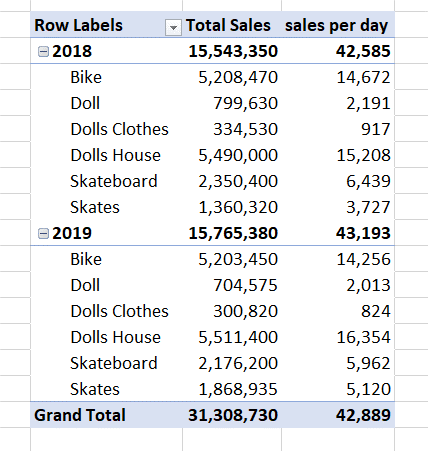
This pivot table contains two measures. The first measure is Total sales.
Total Sales=sum(product_sales[Sales value])
This measure takes the Sales value column in the sales table and sums the values.
The second measure is Sales per day.
=Round([total sales]/COUNTROWS(DISTINCT(product_sales[Date])),0)
Where:
COUNTROWS(DISTINCT(product_sales[Date]) will return the number of days there are actual sales.
Total sales are then divided by the number of days with sales, and the ROUND function is used as we are looking at monetary values.
This is based on the number of days with sales, and not the number of days in the year. I’m sure you are wondering why it might be calculated this way. Well, imagine a product was launched in December and is only available for 31 days. From these 31 days, sales were made on 28 of them. Do you think it would be correct to calculate the average sales as the total sales divided by 365 days or by 28 days? This depends on your needs. In this example, we only want to get the sales per day, based on the number of days there are actual sales.
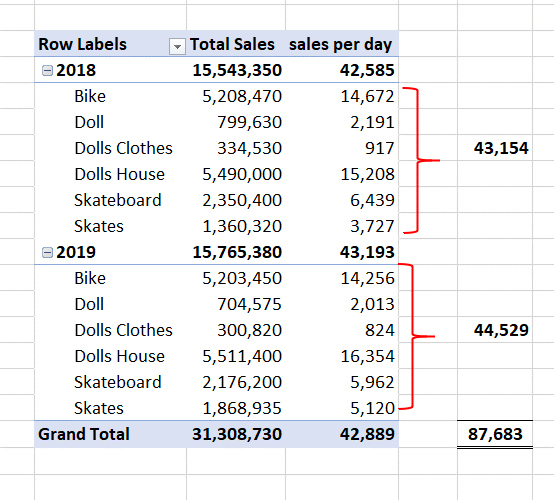
The problem is not how the days are calculated, the problem lies within the Subtotals and total. If we add up our values for 2018 we get 43,154. Not 42,585 as shown.
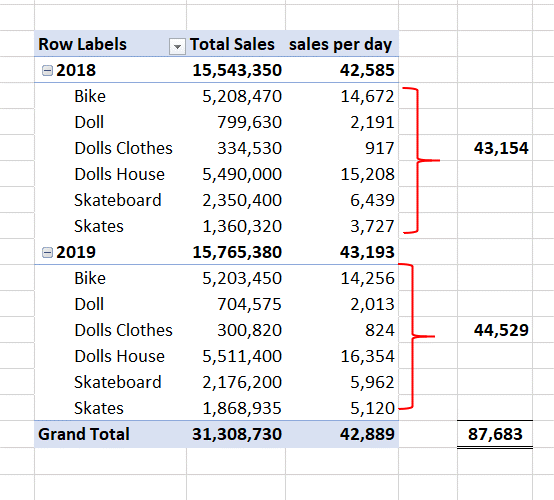
So why does this happen? Well, again it's down to the filter context.
We will create a measure to show the days with sales and place this in our table to show you what is happening. The measure is:
=COUNTROWS(DISTINCT(product_sales[Date]))
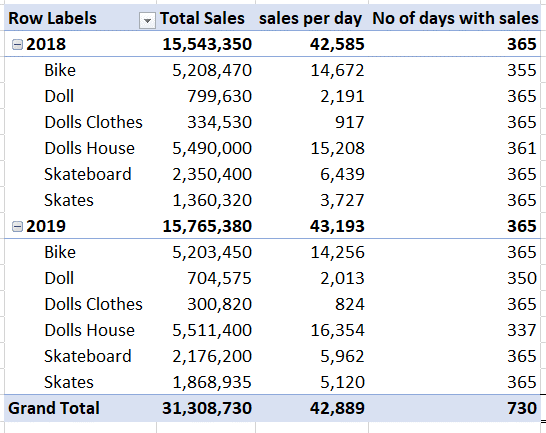
Now let's work through the figures for Bike in 2018. The table is filtered by both the year(2018) and the product (Bike). Then a distinct count of the dates is carried out. In this case, there are 355 days with sales.
In our sales per day value for Bikes in 2018, the total sales, 5,208,470 is divided by 355 to give our sales per day.
However, we can see that the number of days with sales is different for each product as this is calculated based on the filter context of both product and year.
Now let’s look at the subtotals. Between all the products, there are sales every day of the year, so the distinct count of days is 365. Our total sales value for 2018 is divided by 365. As our products are not all divided by 365, there is no way the subtotal value can be the same as the sum of the sales per day.
With the total value, there is no filter on the years or the products. Therefore, the total count of the distinct days is 730, and the total sales with no filter are then divided by this value
Removing Totals and Subtotals
When totals and subtotals are not correct, we have the option to either remove them and leave a blank, or create a measure to calculate the values we expect. Let’s look first at removing the totals.
To remove the totals we need to establish if the filter context applies. We can do this using expressions that return a true/false statement. By combining these true false expressions with an IF statement, we can define what is returned when the filter context is applied and what to return when the filter context is not applied.
Step 1 – Create a logical test to see if a row is a total or subtotal
Each one of the following functions will return a true/false. HASONEVALUE, ISFILTERED and HASONEFILTER.
We need to test to see if there is a filter on the product, as it is the product field that is used in the table.
=HASONEVALUE(Products[Product]) – This tests to see if the products column has a value. In the case of the totals and subtotals, there is no filter on products, so a false is returned. The filter is on the year.
=HASONEFILTER(Products[Product]) - This tests to see if the products column has one filter. In the case of the totals and subtotals, there is no filter on products, so a false is returned. The filter is on the year.
=ISFILTERD(Products[Product]) - This tests to see if the products column has any filter on the products column. In the case of the totals and subtotals, there is no filter on products, so a false is returned.
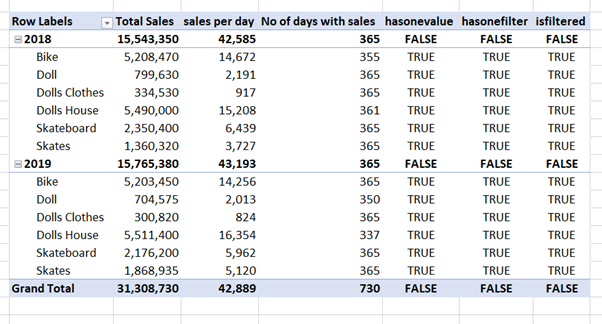
Step 2 - Use Logical test in an IF statement to apply values to non-total rows
Using IF statements, we can now replace these true with the expression No of days with sales.
=if(HASONEVALUE(Products[Product]),[No of days with sales],0)
=if(HASONEFILTER(Products[Product]),[No of days with sales],0)
=if(ISFILTERED(Products[Product]),[No of days with sales],0)
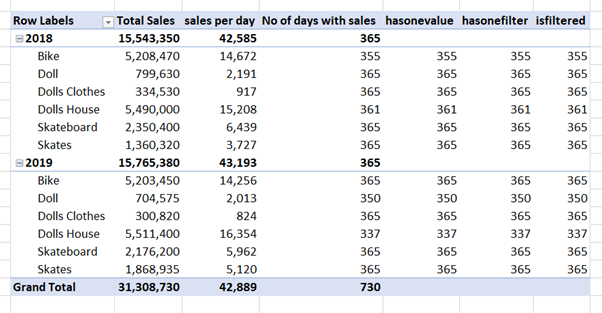
This gives us the correct denominator which we can use in our sales per day calculation.
Step 3 – Apply the IF statement to our original calculation
The original sales per day expression was
=Round([total sales]/COUNTROWS(DISTINCT(product_sales[Date])),0)
Now we can use
=DIVIDE([Total Sales],if(HASONEVALUE(Products[Product]),[No of days with sales],0))
or
=DIVIDE([Total Sales],if(HASONEFILTER(Products[Product]),[No of days with sales],0))
or
=DIVIDE([Total Sales],if(HASONEFILTER(Products[Product]),[No of days with sales],0))
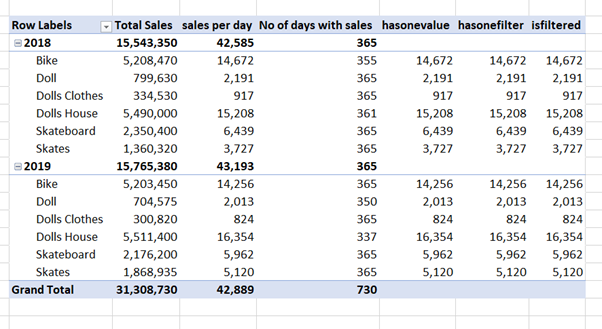
All the totals and subtotals have been removed just as we expected.
Step 4 - Testing removed table totals
It is important that you test your values with additional filters. We can quickly do this by adding some slicers to our pivot table.
The granularity of our measures is based on the Products. If we slice by the Year or Product Category the expressions all work as anticipated and the totals and subtotals do not show.

When we select multiple products from the slicer, both HASONEVALUE and HASONEFILTER preform perfect. But ISFILTERED is showing both incorrect subtotals and total.

The problem occurs when we select only one item from the Products table. In this case, all of the expressions return a value. The subtotals are correct; however, the Grand total is not what we are expecting.

When there is a likelihood of this happening, maybe it's time to consider correcting the totals and subtotals to the value you are expecting.
Correcting Totals and Subtotals in DAX for PowerBI and Power Pivot
We have looked at removing the totals from a table, however it would often be a case that you need the total values for use in the table or in cards and removing them is not really an option.
First, we must find out if we are in a total or subtotal row. We already know how to do this now using HASONEVALUE, ISFILTERED and HASONEFILTER. We used this with an IF statement to calculate the values in the table. We know a False value is returned on totals and subtotals, so now all we have to do is replace this false value with the calculation we need.
In this example we want to show our totals to be the sum of the values.
HASONEVALUE
You will remember we created this measure to test to see if the products column has a value
=HASONEVALUE(Products[Product])
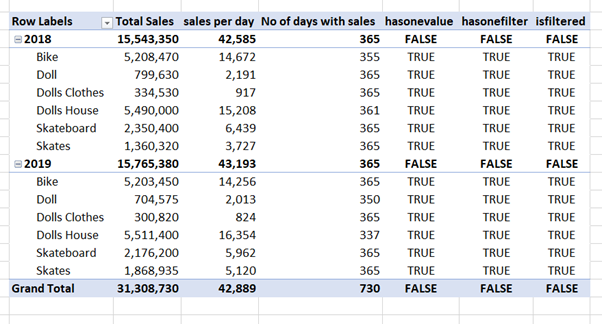
Which returned for us a FALSE in our totals and subtotals. This can be used to identify and separate totals and subtotals from table values. Using and IF statement a separate calculation can be used for both the table values and the totals.
Using the hasonevalue measure created earlier, this expression can be used to calculate the table values. The hasonevalue measure can become the value when true in an if statement
Just to recap, this expression was:
hasonevalue = DIVIDE([Total Sales],if(HASONEVALUE(Products[Product]),[No of days with sales],0))
=if(HASONEVALUE(Products[Product])=TRUE(), [hasonevalue])
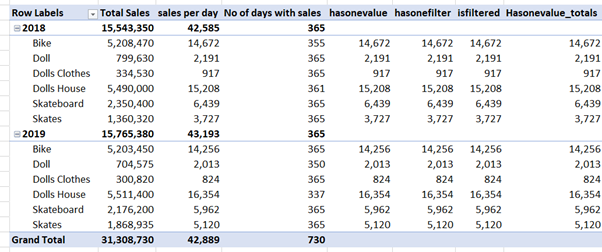
This will calculate our values and not our totals. Now we can carry out a calculation for the totals. This calculation would be a sum of the values returned in each row.
SUMMARIZE to correct totals in DAX
The SUMMARIZE function returns a virtual table, from which we can then carry out calculations on.
SUMX(SUMMARIZE(product_sales,Products[Product],'date'[Year]),[hasonevalue]), [hasonevalue])
The SUMMARIZE part of this function will create a virtual table. This expression will take the Products from the products table and the year column from the date table as the filters. The values in the table are calculated from using the hasonevalue measure we calculated earlier. The virtual table would look something similar to the image.
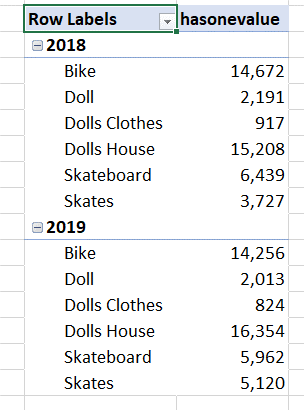
The SUMX part of this expression then iterates over this table and takes all the values returned by hasonevalue and adds these together.
In the SUMMARIZE function we took two group by columns. Products[Product] and date[Year] as this is the granularity of our pivot table. If we change the filters on our table, this measure may no longer work.
Now that we have our calculation, we can add this to our expression
=if(HASONEVALUE(Products[Product])=TRUE(), [hasonevalue],sumx(SUMMARIZE(product_sales,Products[Product],'date'[Year]),[hasonevalue]))
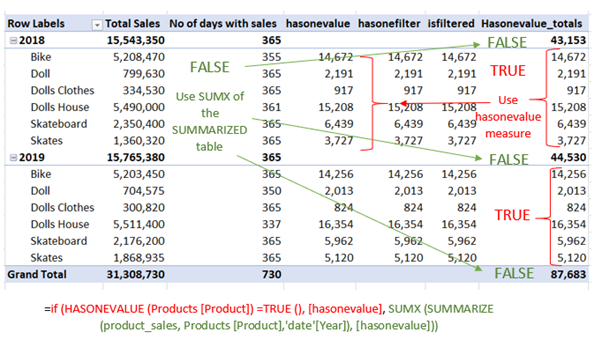
This expression says, if the row has one value for the products, then it’s a values field and go ahead and calculate the hasonevalue measure. If not, then it is a total or subtotal. In that case, create a virtual table with Products and years as the filters. In this table calculate the hasonevalue measure as per the filters. Then sum all of these values together to give us subtotals and totals.
You can also apply this method to HASONFILTER and ISFILTERD.
Do you have any questions or comments on this post? If so, please don't be shy, pop them in the comments box below
SIGN UP FOR OUR NEWSLETTER TODAY – GET EXCEL TIPS TRICKS AND LEARN AND EARN ACTIVITIES TO YOUR INBOX
SIGN UP
Cross posted from my blog with SteemPress : https://theexcelclub.com/learn-how-to-fix-totals-and-subtotals-in-dax-powerbi-and-power-pivot/