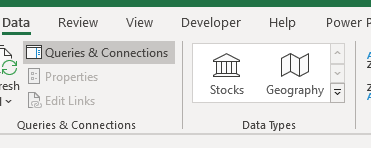
Rich Data types in Excel are now included in Excel 365. These Rich data types are connections to live data and host a suite of information and data types within the one cell. Yes, that's right, loads of data and data types in one cell! And yes, this is still Excel.
The detailed information is contained within cards and this information is easily extracted into the Excel worksheet.
At present, there are two rich data types available. Stocks and Geography. These can be located on the Data ribbon under the grouping Data Types.

Using AI, Excel will recognize different location types such as Countries, Cities and even counties under the Geography data type. With the Stock data type, Excel will recognize stocks on major exchanges, some currency pairs, and even some cryptocurrency pairs.
How to use Rich Data Types
Converting data to rich data types is straight forward. Add text to the cell that released to either stock, currency pairs or Geography. Then from the Data ribbon select either Stock or Geography.
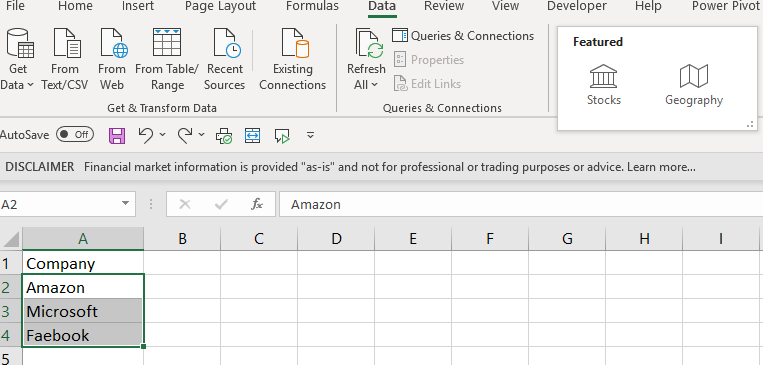
You will recognize a rich data type by the icon beside the text. For stock and currency related data you will see columnar building icon on the left side of the cell. For Geography data you will see a flag icon on the left side of the cell.
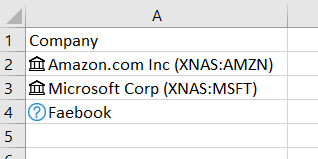
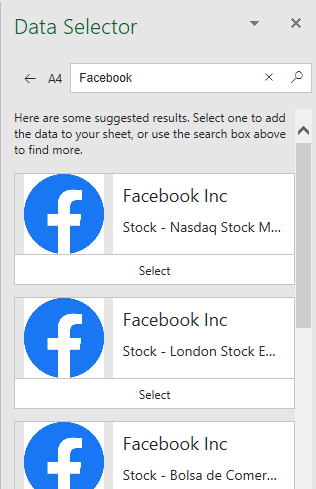
If Excel is unable to find a rich data type to match the cell contents, a question mark will be shown on the left of the cell. By clicking the question mark a data selector pane will open. From here you can select between different data sources for your search.
Once you have converted data to a rich data type, you can view the information from the card by hovering over the icon and left clicking on the mouse. You can also use the keyboard shortcut Ctrl + Shift + F5 to show the card.
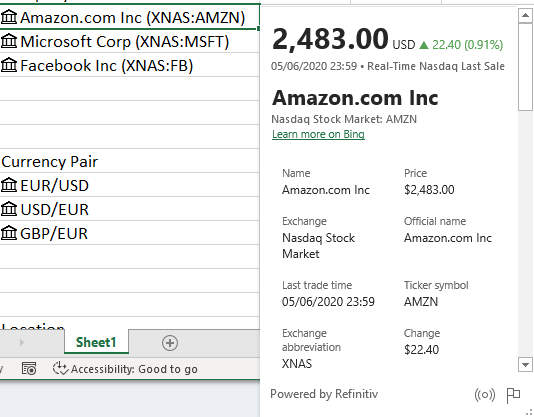
You can also quickly add data from the card to your spreadsheet. This is achieved by clicking on the icon or the insert data field. All fields contained within this card can be extracted to your worksheet.
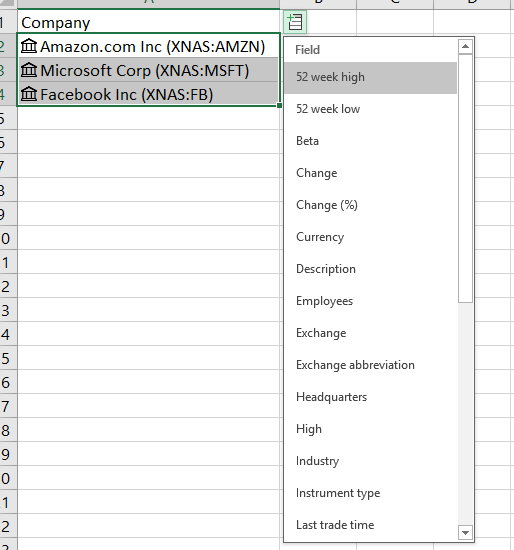
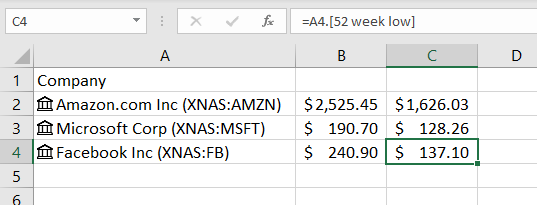
For Example, selecting the 52 week high and the 52 week low will add the data to the next cells in the worksheet.

When you select a cell that contains a field from a rich data type, you will note from the formula bar, the data is extracted using a formula.
Using Formulas with rich data types
As you get more familiar with working with these rich data types and the fields available you can add the fields using a formula instead of using the icon or insert field option.
To add a field from a rich data type using a formula, select the sell you want to see the data in. Enter = and the cell reference that contains the rich data type. A drop down will appear showing you all the fields available.
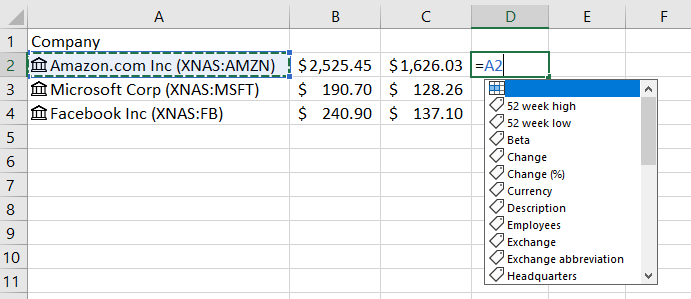
Select the required field, press tab to enter the field to the formula and press enter.
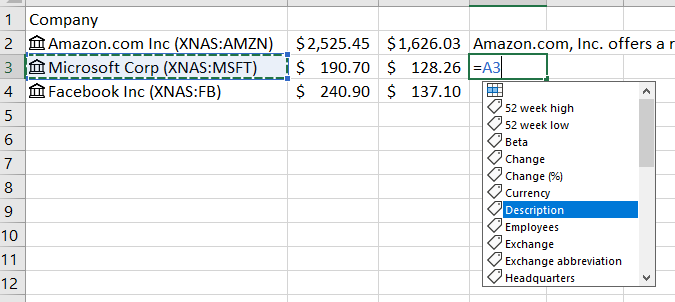
You will note that the fields are show in square brackets.

This way of extracting fields from a rich data type cell is known as the Dot formula type.
There is also a new function, FIELDVALUE that will allow you extract card data from a rich data type cell.
The syntax for FIELDVALUE is
=FIELDVALUE(value, field_name)
Where the value is the rich data type cell, and the field name is the field you want to extract.
When using FIELDVALUE, you must place the field name in quotes. For example
=FIELDVALUE(A2, “52 week high”)
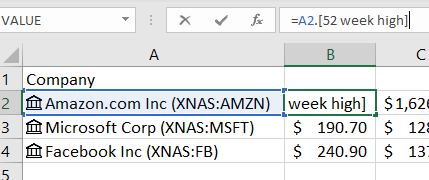
By using either the DOT formula type or the FIELDVALUE function, you can use field data for calculations. For example, if you wanted to calculate the difference between the 52 week high and the 52 week low you could use either of the following
=FIELDVALUE(A2,"52 week high") - FIELDVALUE(A2, "52 week low")
Or
=A2.[52 week high]-A2.[52 week low]
Where A2 contains the rich data type which is of type Stock.

Using Tables with Rich Data types
Excel tables give many benefits over using data in a non-table format. These benefits are applied also to rich data types.
In the examples we have looked at so far, our data has not been in table format. When we extract card information while not in table format, no headers appear telling us what data field we have extracted. However, when we use a table format, the headers do appear.
To convert data to table format, the keyboard shortcut is CTRL + T. Once is table format, when fields are extracted from the Rich data type cell, headers appear in the table allowing you quickly see what each data point relates to.

Currency Pairs
The stock options for rich data types also recognized foreign currency paid and even some cryptocurrency pairs. Not all currency pairs are available yet, and when you are looking for currency pair data, you need to enter your data in the correct format of first currency/second currency.

Updating Rich Data types
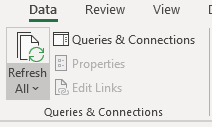
Rich data types are live connections. This means you can keep ensure you data has the most recent information with ease. To update the values from the rich data types, from the Data tab on the ribbons select Refresh All.
Discussion – Rich Data types in Excel
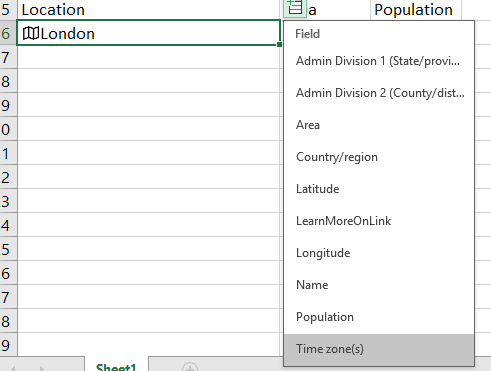
Why don’t you explore some rich data types? We have looked at both Stocks and Currency pairs. However, there is a third type, and this is Geography. Depending on the location type will depend on the data fields that become available. For Example, if you select a county fields will include Admin Divisions, Area, Population and Time Zones.
However, if you enter a country, fields will include Largest City, Households and much more.
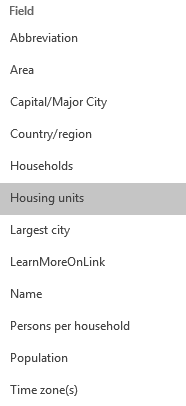
It is also possible to extract further rich data type fields from an existing rich data type.
For example, if we enter London and convert this to a rich data type and select Admin Division (state/province), a new rich data type cell will be populated. In this case, England. You can then extract further information about the secondary rich data type.

Open a blank Excel workbook and enter the county you live into a blank cell. Select the data type Geography and then extract the Area and Population. What values do you get?
Now using a formula from the Rich data type cell, calculate the Population per Sq KM. (area). What answers did you get? Which formula do you prefer to use, the Dot formula or the function FieldValue?
If you had a large workbook and you wanted to locate rich data types, how would you go about this?
Take A FREE course with us Today!


Power Query Excel 365

Best Value Excel and Excel Power Tool Learning. Access All Areas, Unlimited Learning Subscription

SIGN UP

- includes XLOOKUP and will soon include Dynamic Arrays

Power Query Excel 365


SIGN UP
New to Excel? Check out our Ultimate beginner Excel Guide here.
New to Excel Power Tools? Check out these amazing Power Pivot, Power Query and Power view demonstrations
New to DAX for Power Pivot and Power BI? Let us help you get started
Sign up for my newsletter – Don’t worry, I won’t spam. Just useful Excel and Power BI tips and tricks to your inbox with Earn and Learn activities.
SIGN UP NOW
Now there is value in Learning with The Excel Club and our Learn and Earn activities.
We are the first Excel, PowerBI and DAX blog in the world where you can Earn tokens while you Learn.
To Find out more now and start earning while you are learning Excel and Power BI
Enjoyed this Excel Article? Before you leave, it’s only fair that you share
Cross posted from my blog with SteemPress : https://theexcelclub.com/rich-data-types-in-excel/


This is amazing. I added Russia, China, Alice Springs and Hermannsburg into a table to see what sort of data I would get for population and area and infant mortality. The last 2 are from Australia and Hermannsburg is a small aboriginal community new Alice Springs. The biggest country is Russia - almost twice as large ad the US. The limitations are the data - where does the data come from and some data is only available for the larger cities. What happens if you find that the data provided is wrong?
if the data is not correct you can select new data via the web search. Im nearly sure there is a button too to click if the data IS useful. The data comes from the likes of Wikipedia
I would love to see Microsoft add other currency pairs. It would be great to also have animal or plant species included within the data types. For me, the limitation would be forgetting to refresh.
oh animal or plant species would be interesting indeed
That’s pretty cool, I think geography would be interesting to poke around with doing census data or something of the sort.
it does rock, and I know this feature will be improved more over time.